- Ethereum price is trading in negative territory, with losses of some 1.30% on Friday.
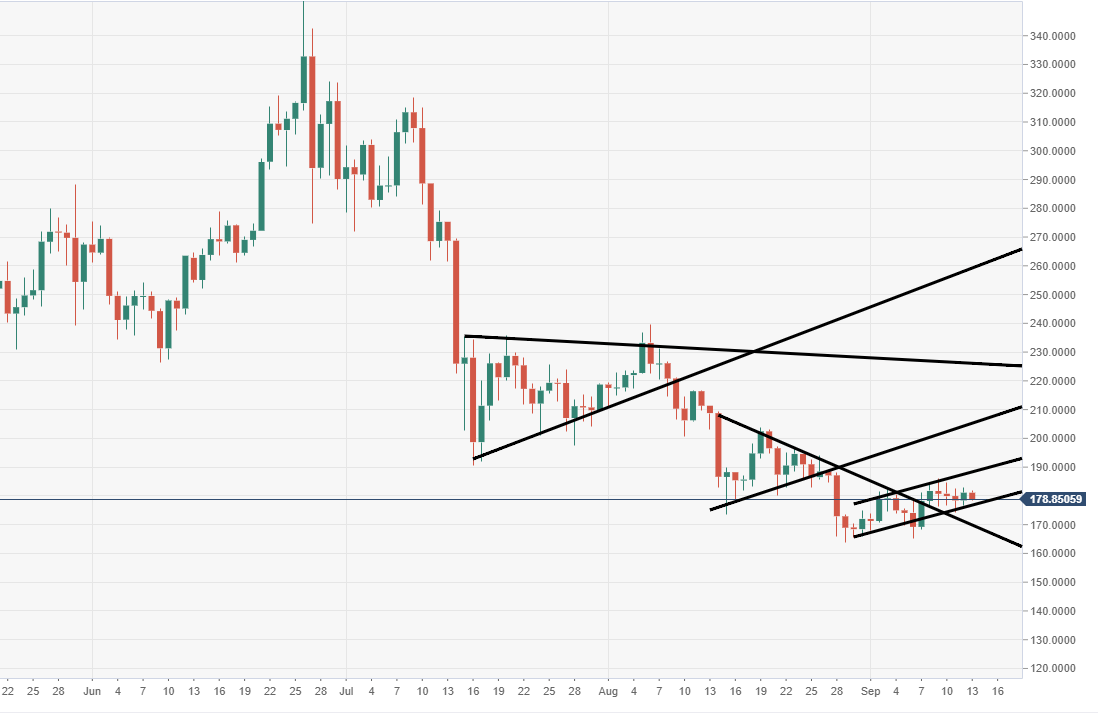
- ETH/USD price action via the daily chart view is moving within another bearish pattern, a flag formation.
- The price is stuck within a bearish trend, continuing to consolidate ahead of further selling pressure. Period of consolidation appears to be regularly sold by the bears at any given opportunity.
Spot rate: 179.38
Relative change: +0.50%
High: 181.81
Low: 178.50
ETH/USD daily chart
- The price is moving within a near-term bearish flag structure, critical lower support tracking at $175.
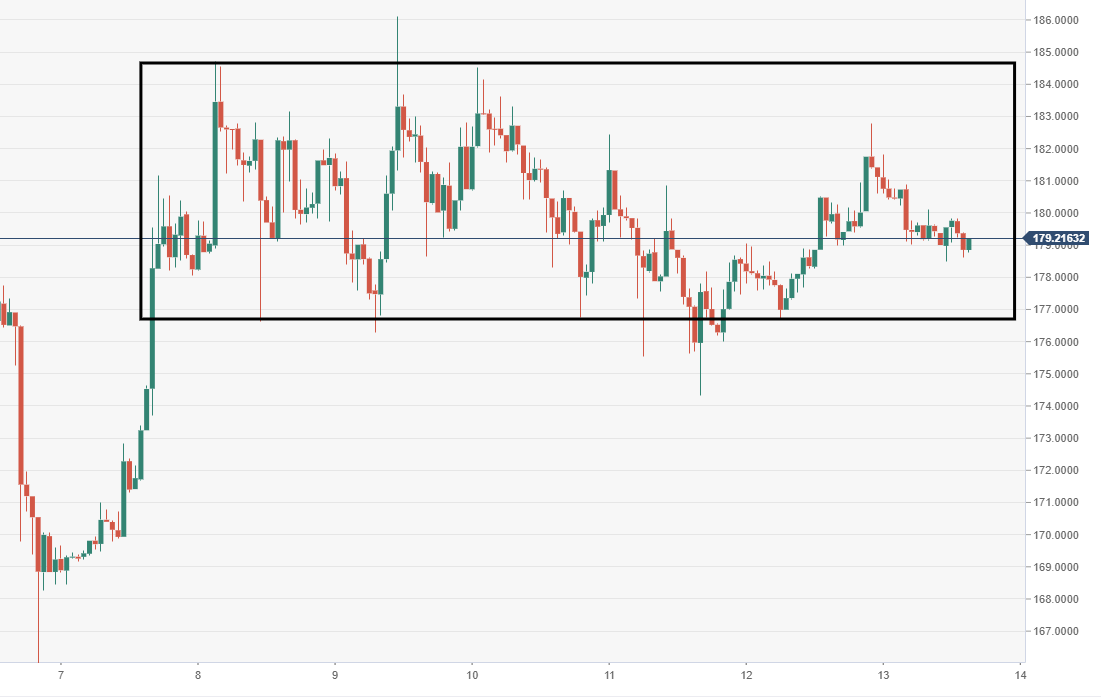
ETH/USD 60-minute chart
- Price action via 60-minute chart view is moving within a narrowing range-block formation. ##