- BTC/USD went down from $10,379.75 to $10,326 in the early hours of Saturday.
- The price has five support levels on the downside.
Bitcoin has had a bearish start to Saturday wherein the price fell from $10,379.75 to $10,326. In the process, BTC/USD charted two bearish days in a row, wherein the price fell from $10,425 to $10,326. The hourly breakdown of Saturday shows us that the price achieved an intra-day high of $10,365, where it found resistance and fell.
BTC/USD daily confluence detector
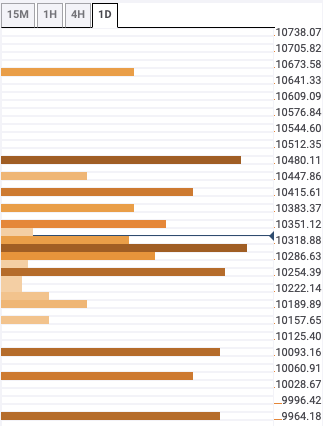
The support levels are at $10,300, $10,275, $10,100, $10,055 and $9,975. $10,300 has the 50-day simple moving average (SMA 50), 1-day Fibonacci 61.8% retracement level, 1-week Fibonacci 61.8% retracement level and 1-hour Bollinger band middle curve. $10,275 has the 15-min Bollinger band lower curve, while the $10,100 has the 1-day Fibonacci 38.2% retracement level and 1-week Fibonacci 38.2% retracement level. $10,055 has the 1-month Fibonacci 23.6% retracement level. Finally, $9,975 has the 1-day Fibonacci 23.6% retracement level and 1-week Fibonacci 23.6% retracement level.
On the upside, the resistance levels are at $10,500 and $10,425. $10,500 has the 1-month Fibonacci 38.2% retracement level and 4-hour Bollinger band upper curve. $10,425 has no confluences detected.
