- Ethereum price is trading in negative territory, with losses of some 0.25% on Monday.
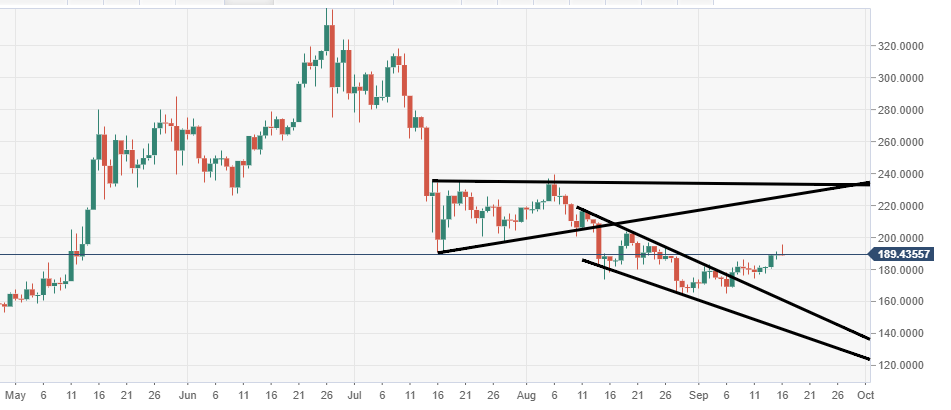
- ETH/USD price action via the daily chart view has broken out to the upside from a descending wedge structure.m
- A large barrier of resistance was observed at the $180 price mark, the daily break and closure above is attractive for further potential buying momentum.
Spot rate: 189.40
Relative change: -0.25%
High: 195.80
Low: 188.64
ETH/USD daily chart
- The bulls managed to break above a stubborn barrier of resistance at the $180 mark, leaving room for further upside.
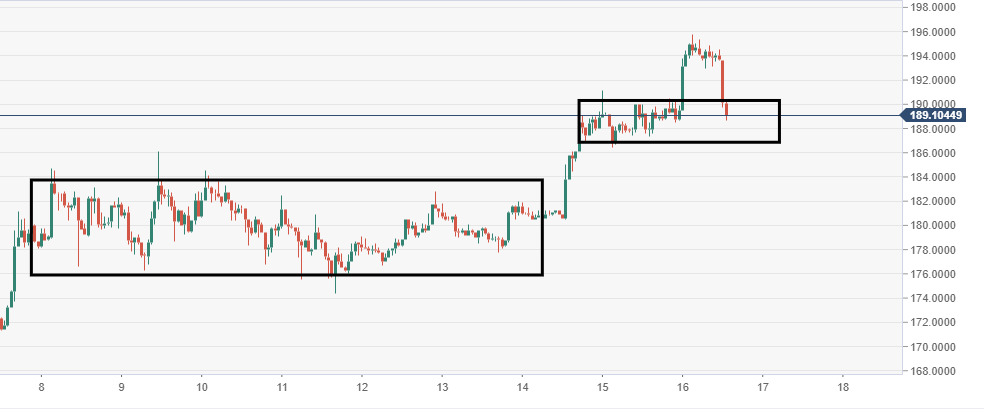
ETH/USD 60-minute chart
- Near-term price action via the 60-minute view, in early hours the bulls smashed out from a narrowing range-block. A retest is being observed of the range area, technically another wave of buying momentum should be found on this retest.