- BCH/USD went up from $318.35 to $325.30 in the early hours of Wednesday.
- The Elliott Oscillator has charted five bullish sessions in a row.
BCH/USD daily chart
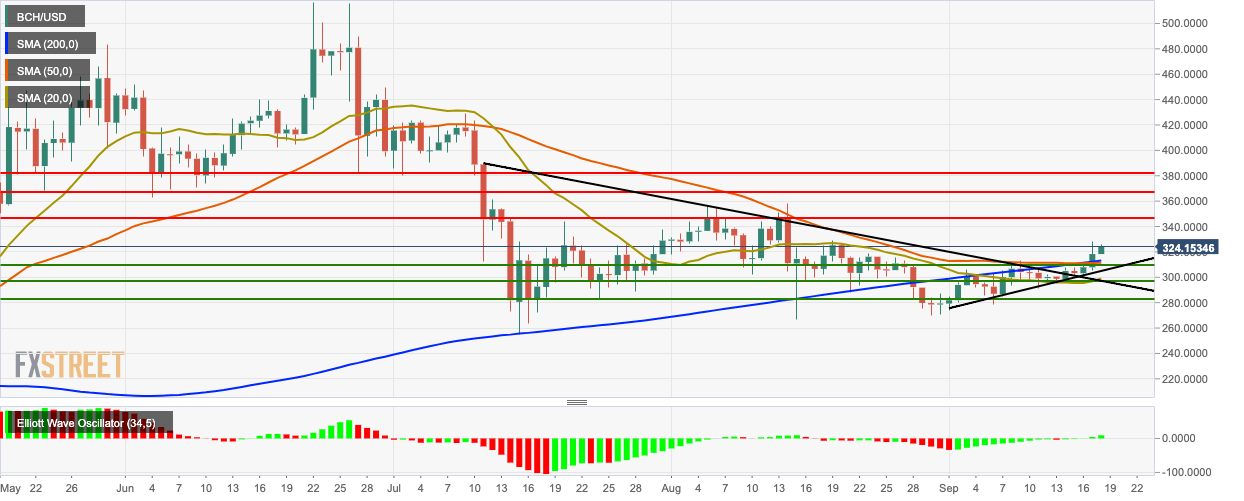
BCH/USD has managed to chart three straight bullish days in a row. Bitcoin Cash has gone up from $318.35 to $325.30 today. The market had a bullish breakout from the triangle formation and is trending above the 200-day Simple Moving Average (SMA 200), SMA 50 and SMA 20 curves. The Elliott Oscillator has charted five bullish sessions in a row.
BCH/USD four-hour chart
-637043698416994741.png)
The four-hour BCH/USD chart went up to $323.85, where it met resistance and dropped to $318.35. The bulls then re-entered the market and took the price back up to $325.30. The four-hour price is trending above the 20-day Bollinger Band, indicating that BCH/USD is currently overpriced. The Relative Strength Index (RSI) indicator has crept back into the overbought zone after exiting it.
BCH/USD hourly chart
-637043697765263836.png)
The hourly BCH/USD has found support on the upward trending line. The hourly price is also trending above the SMA 20, SMA 50 and SMA 200 curves. The Moving Average Convergence/Divergence (MACD) line was about to cross over the signal line before they both diverged and started trending parallelly to each other.
Key Levels
