- Ethereum price is trading in the red, down some 1.85% in the second half of the session.
- ETH/USD bears have forced the price to give up the psychological $200 mark again, which could prove to be punishing.
- The price is running towards its fifth consecutive session in negative territory.
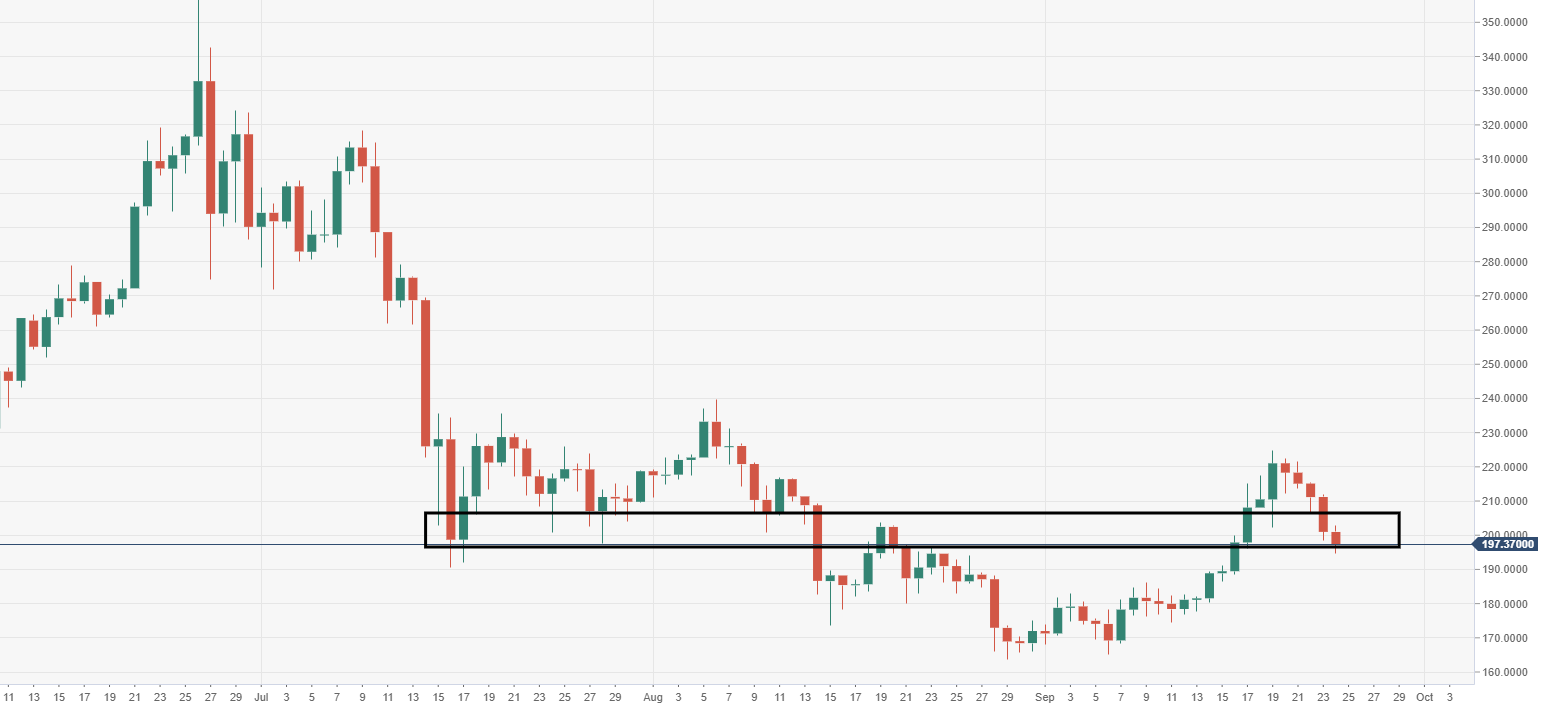
ETH/USD daily chart
Price action is breaking down a critical near-term demand zone, $205-195 price range.
ETH/USD 60-minute chart
Near-term price action broke out of a bearish pennant structure, subject to a retest.
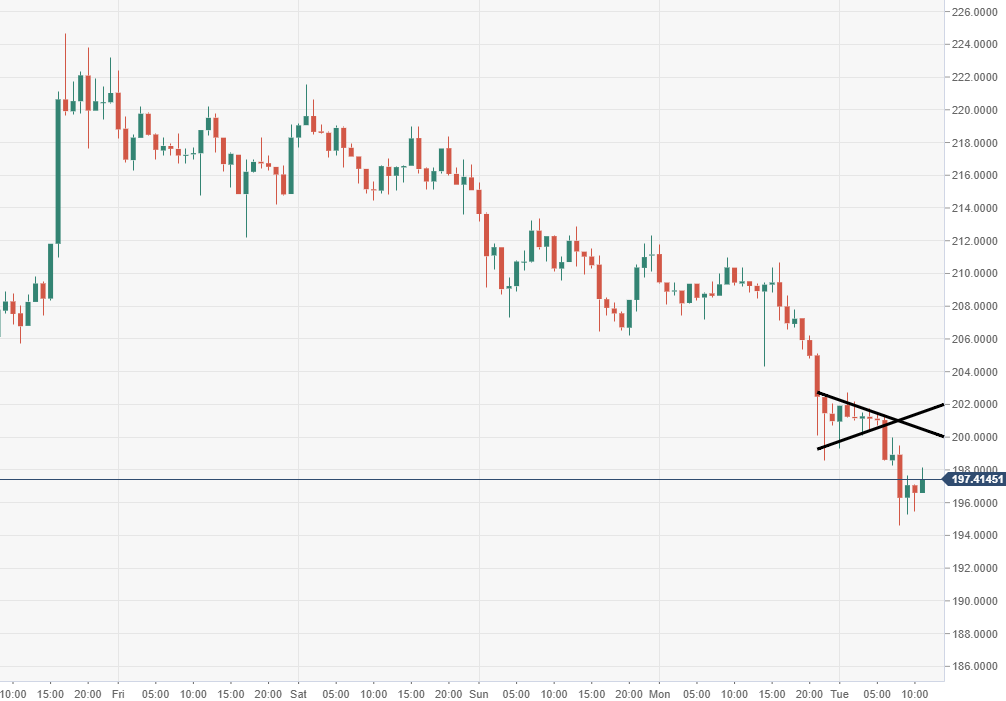
Spot rate: 197.42
Relative change: -1.85%
High: 202.70
Low: 194.60
.
