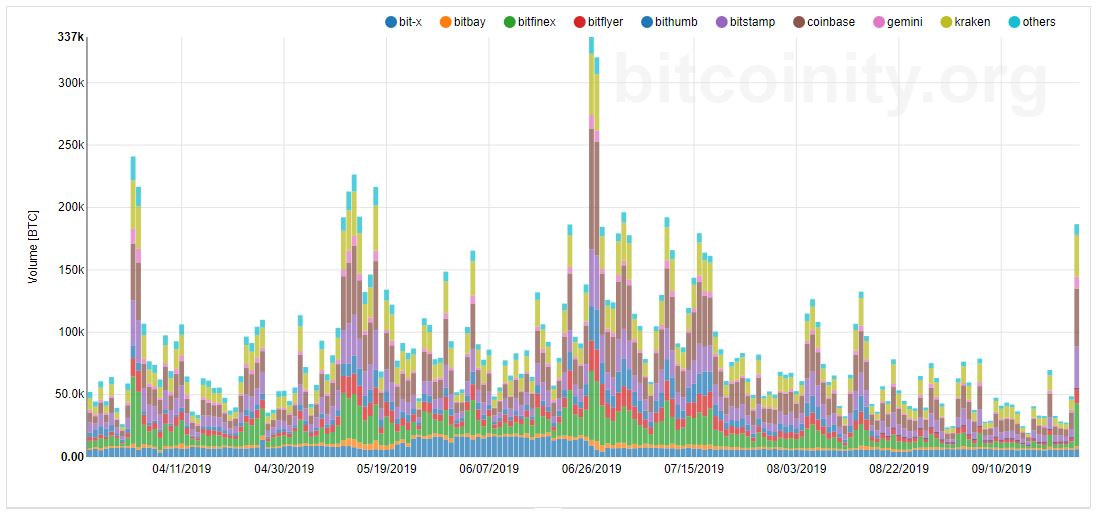
Below is a chart of the last 60 days Bitcoin volume through the major exchanges.
As you can see before yesterday’s price collapse the trend in exchange-traded volume was getting lower and lower.
The last peak was when the price high the highs in June this year.
It’s clear the exchange volume is correlated to price volatility. It may seem obvious but it depends on what inspires that volatility in the first place.
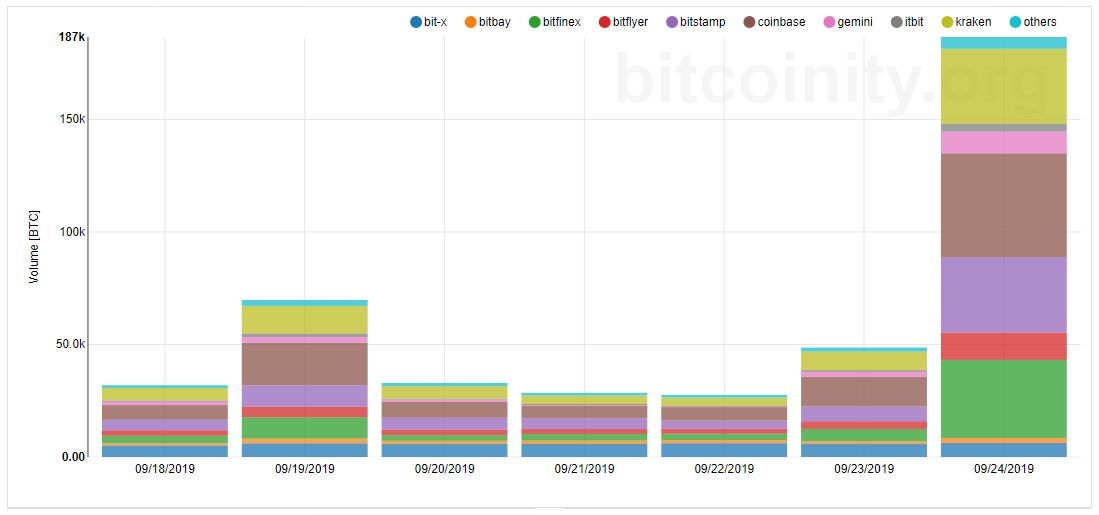
This is a seven-day chart showing exchange-traded data. Coinbase is the biggest exchange on this chart.
I must stress that Binance are not on either of these two charts but according to coinmarketcap they are below Bitfinex on 24hr traded volume.
Looking ahead at least the drop was able to get traders going again but I wish it was under better circumstances.
Now the price has dropped it will be interesting to see if traders find value at lower levels.
(data from data.bitcoinity.org)
