- LTC/USD went up from $55.25 to $57 so far today.
- The RSI indicator is trying to get out of the oversold zone.
LTC/USD bulls have rallied together to mount a comeback after six straight bearish days. The price has gone up from $55.25 to $57 so far today. As with the rest of the crypto market, LTC/USD had a heavily bearish Tuesday where the price fell from $66.67 to $55.25. The hourly breakdown shows us that the price plummetted from $65 to $57.25 within an hour. The bulls then tried to make a comeback by taking LTC/USD back up to $59.40. However, the bears took back control and brought the price down to $55.25. The bulls started strong today and brought the price up to $57.67. However, the bears have since corrected the price down to $57. The bulls will want to garner enough momentum to get back into the $60-zone.
LTC/USD daily chart
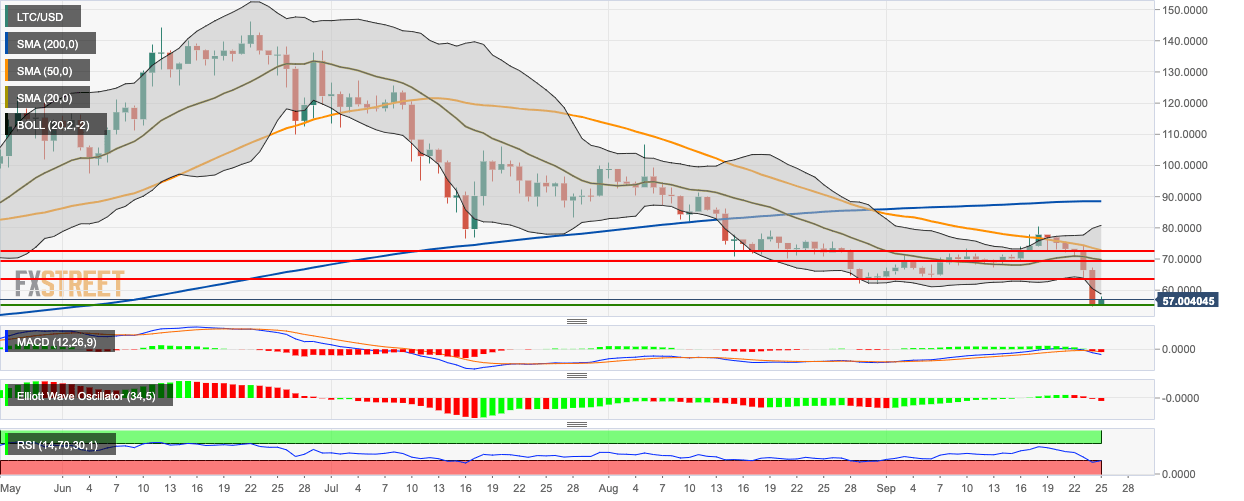
This Tuesday, the price fell below the 20-day Bollinger Band, indicating that it was undervalued. The bulls are currently trying to take the price back into the Band. The widening of the Bollinger jaw indicates increasing market volatility. LTC/USD is also trending below the 200-day Simple Moving Average (SMA 200), SMA 50 and SMA 20 curves.
The Moving Average Convergence/Divergence (MACD) indicator shows two straight bearish sessions, while the Elliott Oscillator has had four consecutive bearish sessions. The Relative Strength Index (RSI) indicator is trying to get out of the oversold zone.
