- XMR/USD has fallen from $60 to $58 in the early hours of Thursday.
- The Relative Strength Index (RSI) indicator is right at the edge of the oversold zone.
XMR/USD daily chart
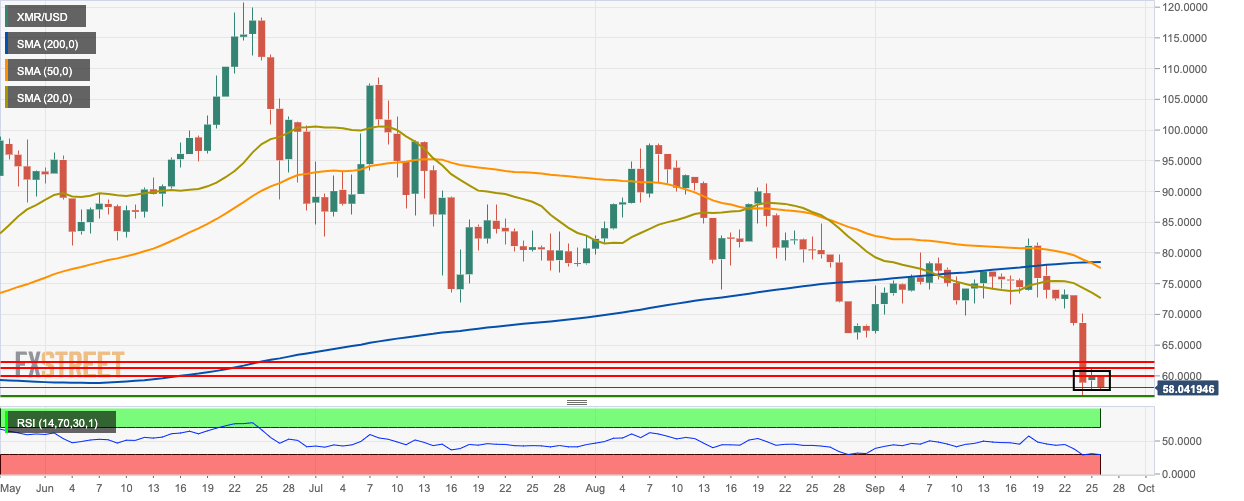
XMR/USD is consolidating in a flag formation. The price has gone down from $60 to $58 today, despite a brief bullish respite this Wednesday. The 200-day Simple Moving Average (SMA 200) has crossed over with the SMA 50 curve to chart the death cross pattern, which is heavily bearish. The Relative Strength Index (RSI) indicator is right at the edge of the oversold zone.
XMR/USD four-hour chart
-637050658905710162.png)
XMR/USD dropped below the 20-day Bollinger Band but then re-entered it after trending horizontally. The wide 20-day Bollinger jaw indicated increasing market volatility. The price is trending below the SMA 200, SMA 50 and SMA 20 curves. The Moving Average Convergence/Divergence (MACD) indicator shows decreasing bearish momentum.
XMR/USD hourly chart
-637050658589143540.png)
The hourly market has found resistance at the downward trending line and the SMA 20 curve. The Eliott Oscillator shows three straight bearish sessions.
Key Levels
