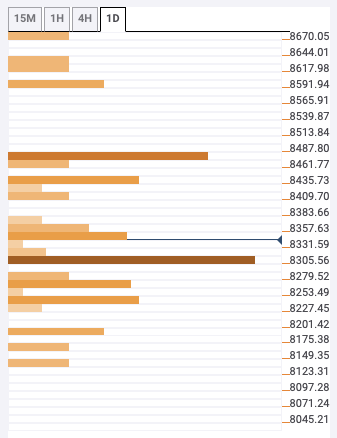
- The daily confluence detector shows a healthy support level at $8,315.
- The daily price chart is currently consolidating in a flag formation.
BTC/USD daily chart has gone up from 8.282.30 to $8,535 as markets opened this Tuesday. The price is currently consolidating in a flag formation, currently prepping itself for a potential breakout. The hourly BTC/USD is trending in a narrow price region between $8,252.80 and $8,371.50. The daily BTC/USD daily confluence detector shows a healthy support level at $8,315 and a strong resistance level at $8,475.
BTC/USD daily confluence detector
$8,475 resistance level has the one-day previous high and one-month Fibonacci 23.6% retracement level. On the downside, the $8,315-level has the 5-day Simple Moving Average ( SMA 5), SMA 50, SMA 200 and 15-min Bollinger band lower.

