- IOT/USD went through a period of consolidation after charting a morning star pattern.
- This Tuesday’s session has peeked above the 20-day Bollinger band.
IOT/USD had a hugely bullish Tuesday on the back of Intel’s endorsement. In one of its patents for IoT, Intel gave a shoutout to Iota and Tangle. The price spiked up from $0.273 to $0.29. Looking at the daily chart, we can see that IOT/USD was going that before Tuesday, the price was going through a period of consolidation after charting the morning star pattern (blue box). The hourly IOT/USD chart shows us that the price had dropped to $0.271, where it found support and went up to $0.296. After reaching that level, IOT/USD trended horizontally for a bit before dropping to $0.29.
IOT/USD daily chart
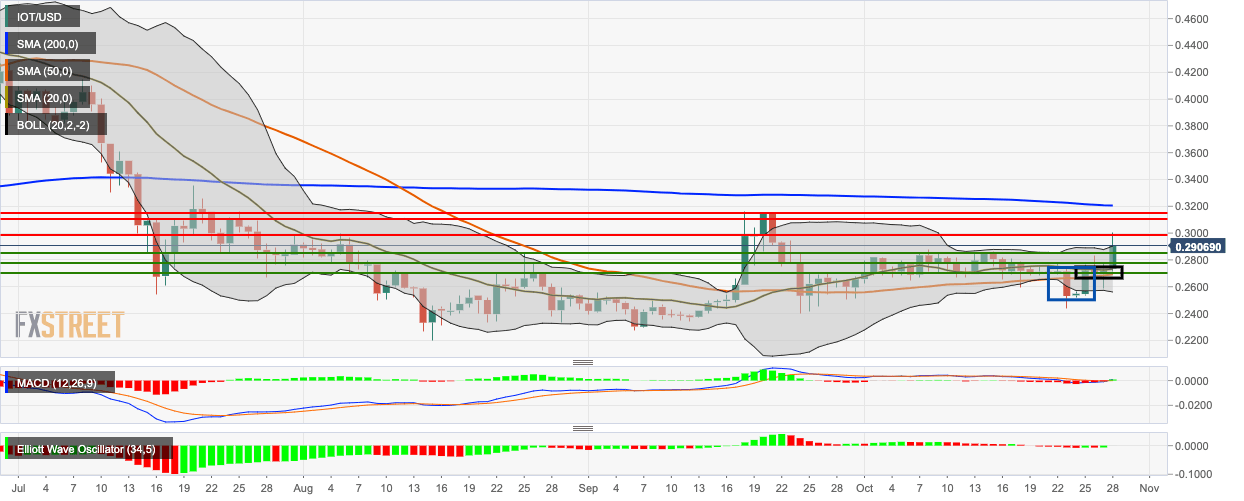
Tuesday’s price action took the price above the 20-day Bollinger band and must overcome resistance at $0.30 to continue upwards momentum. The 20-day and 50-day Simple Moving Average (SMA 20 and SMA 50) curves act as immediate market support. The Moving Average Convergence/Divergence (MACD) indicates a reversal of market momentum from bearish to bullish. The Elliott Oscillator has had two green sessions out of the last three.
