- Ethereum price resumed the decline after a failed recovery attempt.
- Strong support is created by the broken trendline at $173.00.
ETH/USD broke below $180.00 after an unsuccessful attempt to settle above $185.00 handle during early Asian hours. At the time of writing, ETH/USD is changing hands at $179.50, down 2.5% both on a day-to-day basis and since the beginning of the day.
Ethereum is moving ins sync with thee cryptocurrency market where Bitcoin and aim major altcoins are drifting away from the recent highs.
Ethereum’s technical picture
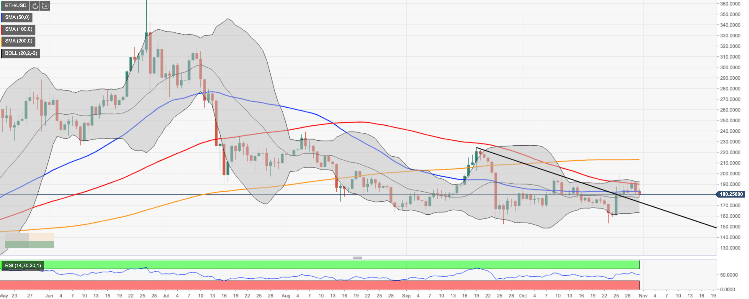
On the daily charts, the initial support is created by the middle line of the Bollinger Band at $177.70. Once it is out of the way, the sell-off is likely to gain traction with the next focus on $173.00 area, which includes a sloping trend line from September 19 high at $224.68. This trend line had served as a strong resistance until it was broken on October 26. If this support zone goes way, the downside momentum might start snowballing. The next bearish target awaits at $170.00. It is flowed by the lower line of daily Bollinger Band at $163.30.
On the upside, the recovery is capped by SMA50 (Simple Moving Average) on a daily chart currently at $183.30. However, the bulls need to clear psychological $180.00 before they get to SMA50 and proceed to the intraday high of $185.50. We will need to see a sustainable move above this handle for the extended recovery towards psychological $190.00 strengthened by SMA100 daily.
ETH/USD, the daily chart chart