- BTC/USD has recovered from the intraday low.
- The short-term consolidation may continue in the nearest future.
BTC/USD reached the bottom at $9,129 on Thursday and recovered to $9,200 by press time. Despite the recovery, BTC/USD is trading with 1.5% losses both on a day-to-day basis and since the beginning of the day.
Bitcoin confluence levels
Looking technically, there are quite a few important barriers clustered above the current price, which means that BTC/USD may have a hard time on its quest to the North. The retreat looks like a path of least resistance at this stage, though we will need to see a sustainable move below $9,000 for the sell-off to gain traction.
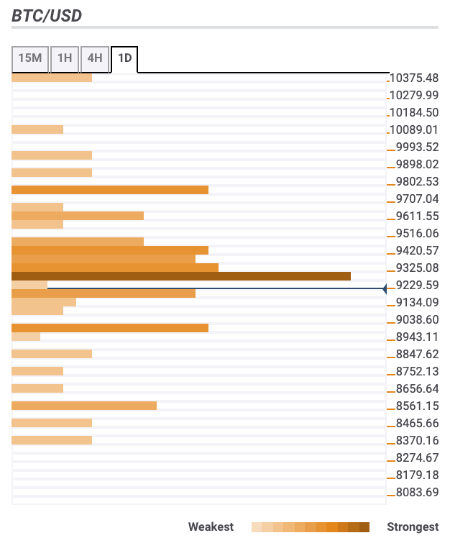
Let’s have a closer look at the technical levels that may serve as resistance and support areas for the coin.
Resistance levels
$9,250 – 38.2% Fibo retracement monthly, the lowest level of the previous day, SMA50 (Simple Moving Average) 4-hour, SMA200 1-hour
$9,300 – SMA100, SMA50 1-hour, 61.8% Fibo retracement daily and weekly, the middle line of 4-hour Bollinger Band
$9,750 – 23.6% Fibo retracement weekly and monthly
Support levels
$9,150 – the lower lines of 4-hour and 1-hour Bollinger Bands, Pivot Point 1-day Support 2, 161.8% Fibo projection daily
$9,000 – the lowest level of the previous week
$8,550 – SMA200 4-hour, 61.8% Fibo retracement monthly.