- TRON is trading 4.5% higher on the session as crypto sentiment improved on Wednesday.
- The price is now stuck at the internal trendline highlighted on the chart.
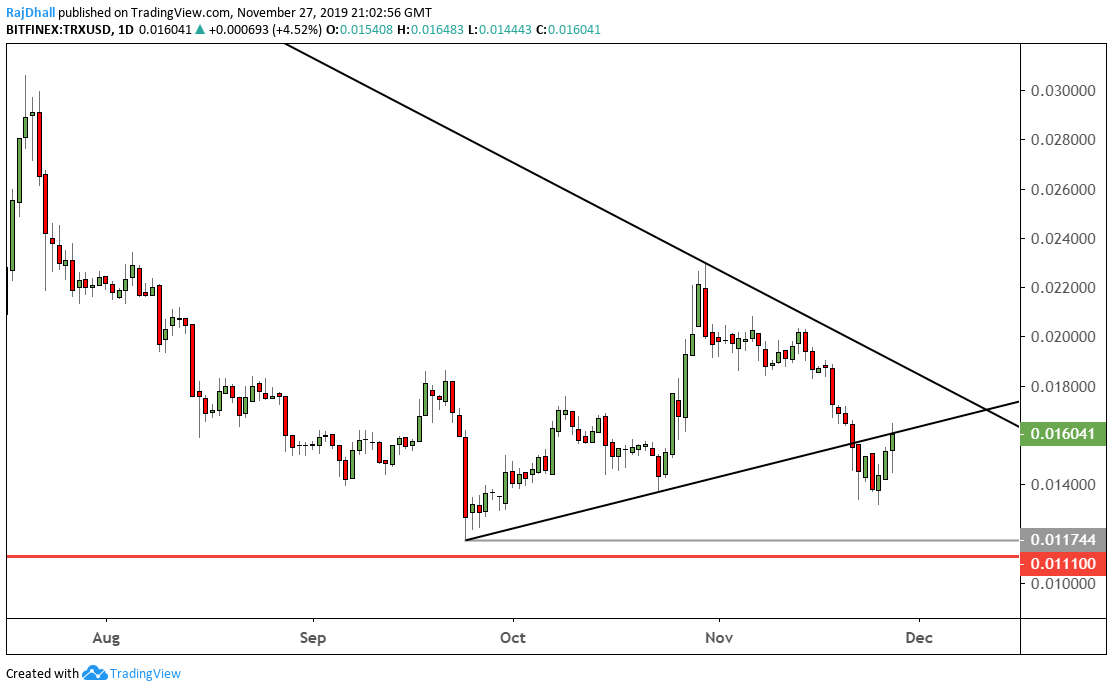
TRX/USD Daily Chart
The TRX/USD price structure was more bullish than most of the other cryptocurrencies during the fall on 22nd November.
Now it seems that the price has run into some trouble at the internal trendline which originated in late September on the chart below.
The line connects the two higher lows after the September 24th low of 0.01174 bottom.
If the daily candle closes above the next resistance could be the target on the way up at 0.01850.
On the intraday 4-hour chart you can see the price made a similar inverse head and shoulders pattern much like Bitcoin and Bitcoin Cash.