- Ethereum trades half a percent higher today as crypto sentiment remains mixed.
- There is a bull flag on the intraday chart that points to some more bullish momentum.
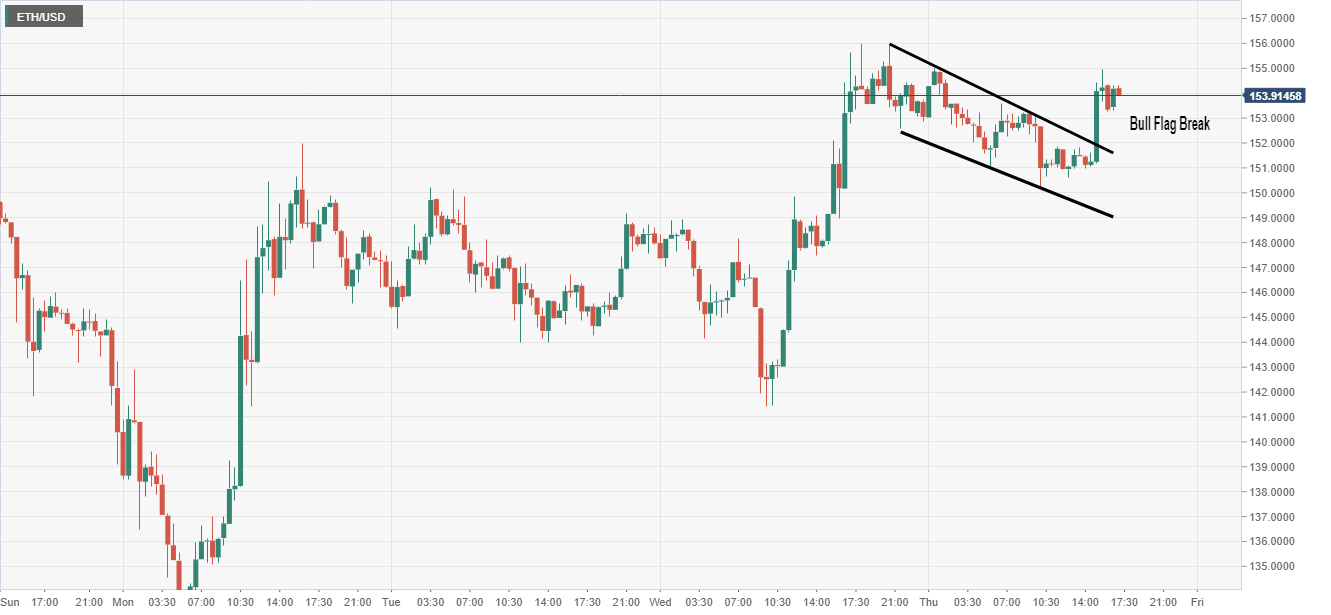
ETH/USD 30-Minute Chart
Ethereum has broken the bull flag chart pattern on the 30-minute chart.
The pole of the formation kicked off on Wednesday after the price hit a low of 141.44.
Sometimes patterns can come back to retest so be aware but the initial signs are good.
The wave high resistance is 155.95 so a break and close above that level is key.
Additional Levels
