- The MACD indicator shows a reversal of bearish momentum.
- The Elliott Oscillator has had six straight bullish sessions.
Following a bullish Sunday, the bears were able to take full control this Monday. EOS/USD dropped dramatically from $2.795 to $2.70. The hourly breakdown of Monday shows us that EOS/USD fell from $2.80 to $2.71 within five hours. Following a brief resurgence to $2.74 before dropping further to $2.67. Since then. The price has gone up to $2.70.
EOS/USD daily chart
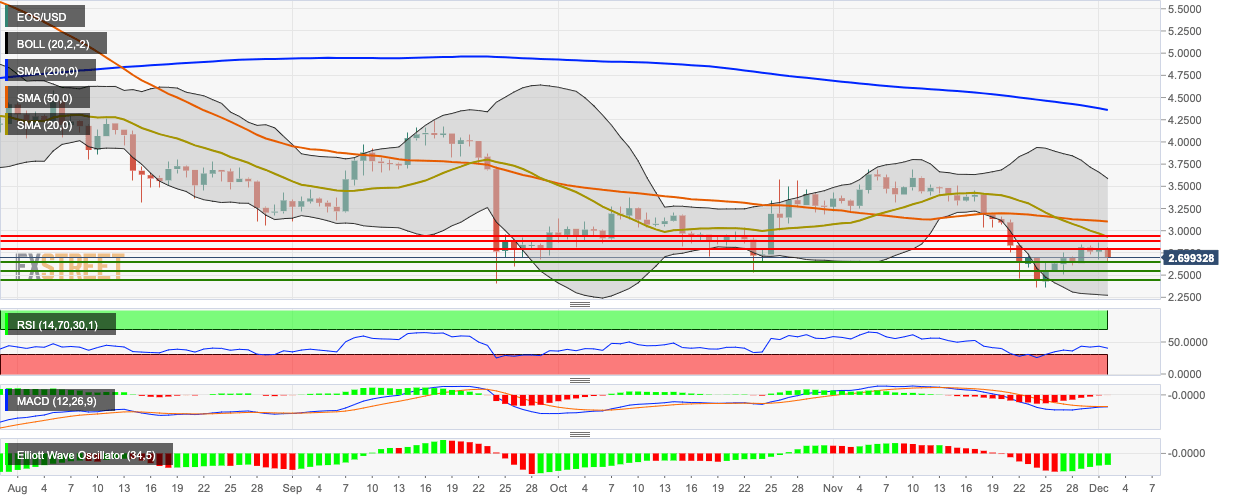
The daily EOS/USD chart is floating below the 200-day Simple Moving Average (SMA 200), SMA 50 and SMA 20 curves. The Relative Strength Index (RSI) indicator is trending around 40.30 and the Elliott Oscillator has had six straight bullish sessions. The Moving Average Convergence/Divergence (MACD) indicates a reversal of bearish momentum.
