- Daily price chart is floating below the SMA 200, SMA 50 and SMA 20 curves.
- The RSI indicator is trending around 39, next to the oversold zone.
BCH/USD daily chart
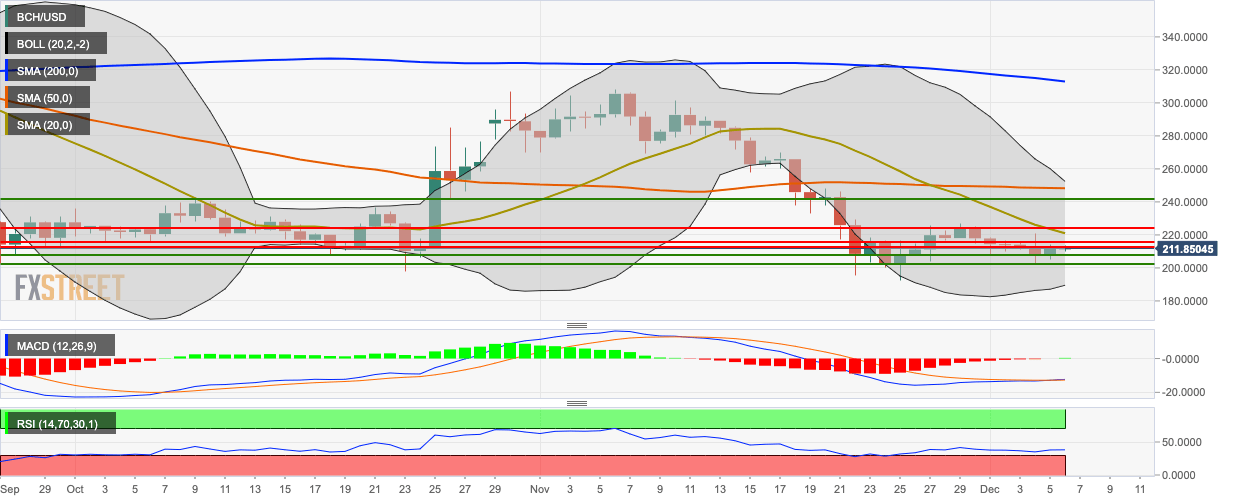
BCH/USD is on course of charting its second straight bullish day. Currently, the price has gone up slightly to $211.75 and is floating below the 20-day Simple Moving Average (SMA 20), SMA 50 and SMA 200 curves. The Moving Average Convergence/Divergence (MACD) indicator has reversed its momentum from bearish to bullish, while the Relative Strength Index (RSI) indicator is trending around 39. The 20-day Bollinger jaw has narrowed, showing decreasing price volatility.
