- RSI indicator in the daily chart is creeping above the oversold zone.
- The Elliot Oscillator in the four-hour chart has had four straight green sessions.
DASH/USD daily chart
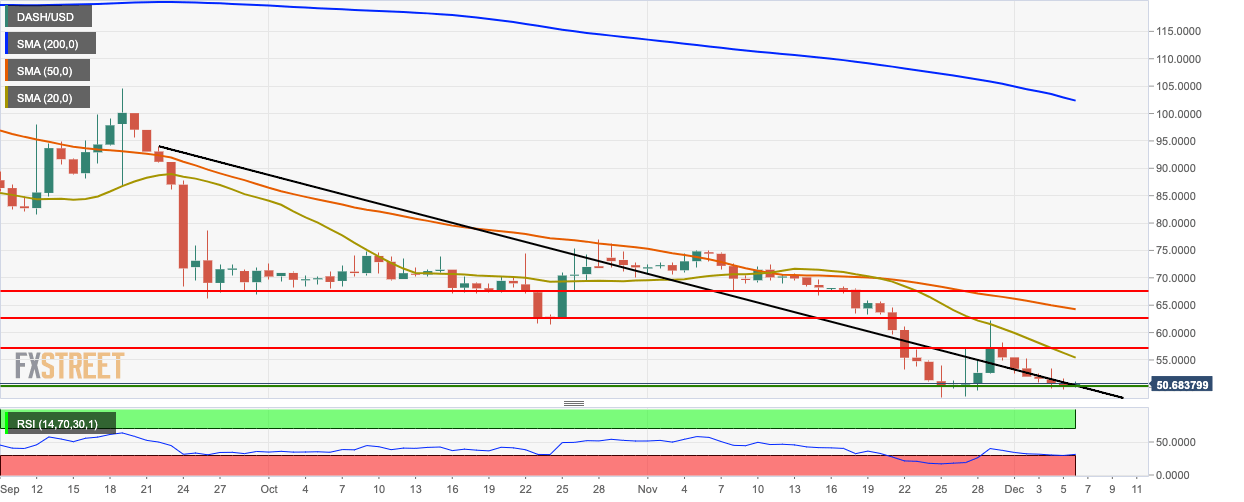
The buyers have taken control of the daily market after six straight bearish days and are attempting to break above the downward trending line. DASH/USD is currently priced at $50.65. The Relative Strength Index (RSI) indicator has crept above the oversold zone.
DASH/USD four-hour chart
-637112041662647543.png)
The four-hour DASH/USD chart has found resistance at the 20-day Simple Moving Average (SMA 20) curve. The 20-day Bollinger jaw has narrowed, indicating decreasing price volatility. The Elliott Oscillator has had four straight green sessions.
DASH/USD hourly chart
-637112041379827401.png)
The hourly DASH/USD is trending in an upwards channel formation and has broken past the resistance provided by the SMA 20 and SMA 50 curves. The price is floating below the red Ichimoku cloud. The Moving Average Convergence/Divergence (MACD) indicator shows increasing bullish momentum.
Key Levels
