- Both Bitcoin (BTC) and Ethereum (ETH) lack any healthy resistance levels on the upside.
- There are healthy support levels on the downside that are holding the price up.
It looks like the bulls are finally ready to take over the crypto market, following several days of bearish domination. As per the daily confluence detector, there are no resistance levels on the upside, holding the price down. While Ripple does face resistance up ahead, the price is held up by robust stacks of support. Bitcoin and Ethereum bulls can theoretically push the price back inside the $8,000 and $160 zones, respectively, if they gather enough momentum.
Currently, the price action of the top three coins so far this Saturday is as follows – BTC/USD went up from $7,542.55 to $7,563.75, ETH/USD went up from $149.10 to $149.55 and XRP/USD has gone up from $0.226 to $0.228.
Now, let’s take a look at the daily confluence detectors of the top three coins and examine the strong resistance and support levels.
Top 3 coins daily confluence detector
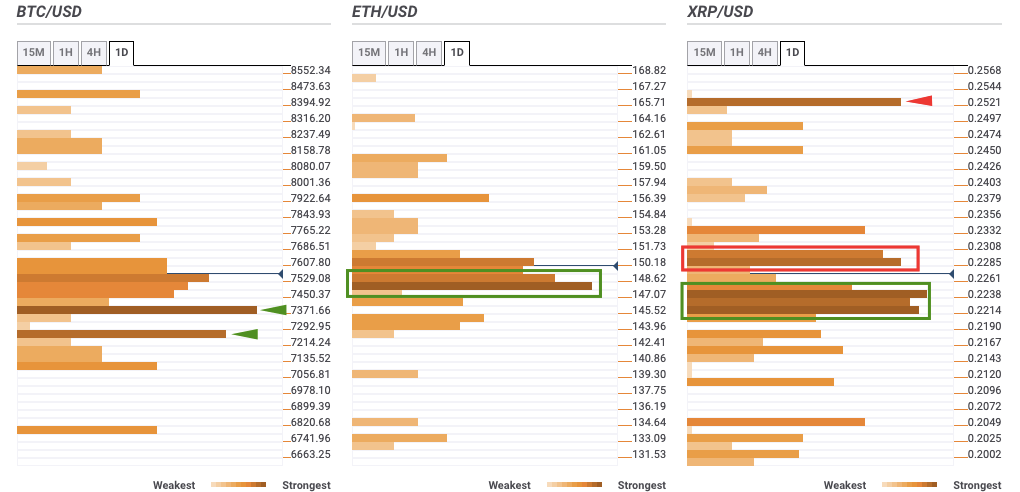
Bitcoin
There are two healthiest support levels on the downside are at $7,400 and $7,275. $7,400 has five-day Simple Moving Average (SMA 5), SMA 100, one-week Fibonacci 38.2% retracement level, four-hour Bollinger Band middle curve and one-day Pivot Point support one. $7,475 has the one-week Fibonacci 23.6% retracement level and one-month Fibonacci 23.6% retracement level.
Ethereum
There is a healthy stack of support between $147.50 to $149. This stack has the SMA 5, SMA 10, SMA 100, SMA 200, one-day Fibonacci 38.2% retracement level, one-day Fibonacci 61.8% retracement level, one-week Fibonacci 38.2% retracement level, one-month Fibonacci 23.6% retracement level, one-hour Bollinger Band middle curve and four-hour Bollinger Band middle curve.
Ripple
On the upside, XRP/USD has a stack of resistance from $0.2285 to $0.2295 which has the SMA 5, SMA 10, 15-min Previous High, one-hour Previous High, four-hour Previous High, one-day Previous High, 15-min Bollinger Band upper curve, four-hour Bollinger Band upper curve, one-hour Bollinger Band upper curve, one-day Pivot Point resistance one and one-month Fibonacci 23.6% retracement level. There is another resistance level at $0.253, which has the Previous Year low.
On the downside, XRP/USD has a support stack from $0.221 to $0.225. The stack sees a confluence of SMA 5, SMA 10, SMA 50, SMA 200, one-day Pivot Point support one, one-day Fibonacci 61.8% retracement level, one-week Fibonacci 23.6% retracement level, and one-day Pivot Point support one.
