- Ripple’s XRP price is trading in the red by some 0.50% in the session on Monday.
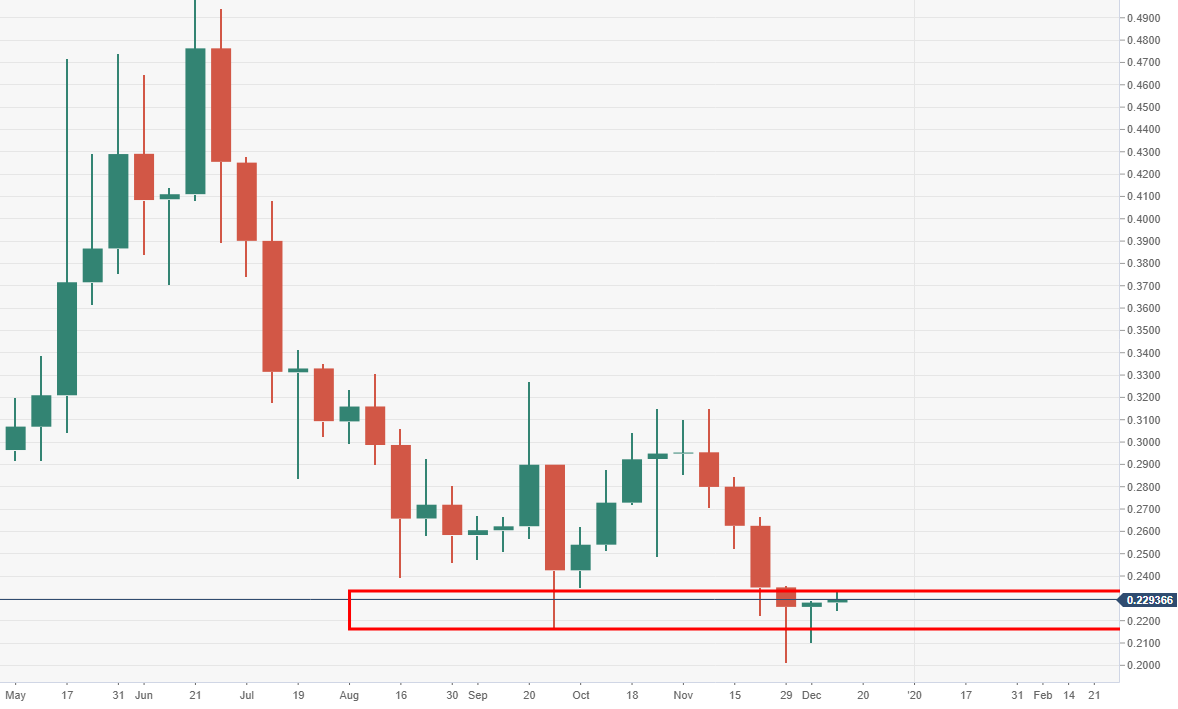
- XRP/USD price action via the weekly chart view shows bears maintain control.
- The price has been falling for five consecutive weeks, as the stubborn trend south remains.
XRP/USD weekly chart
The weekly view can see a chunky area of supply capping upside, $0.2250-0.2500 price range.
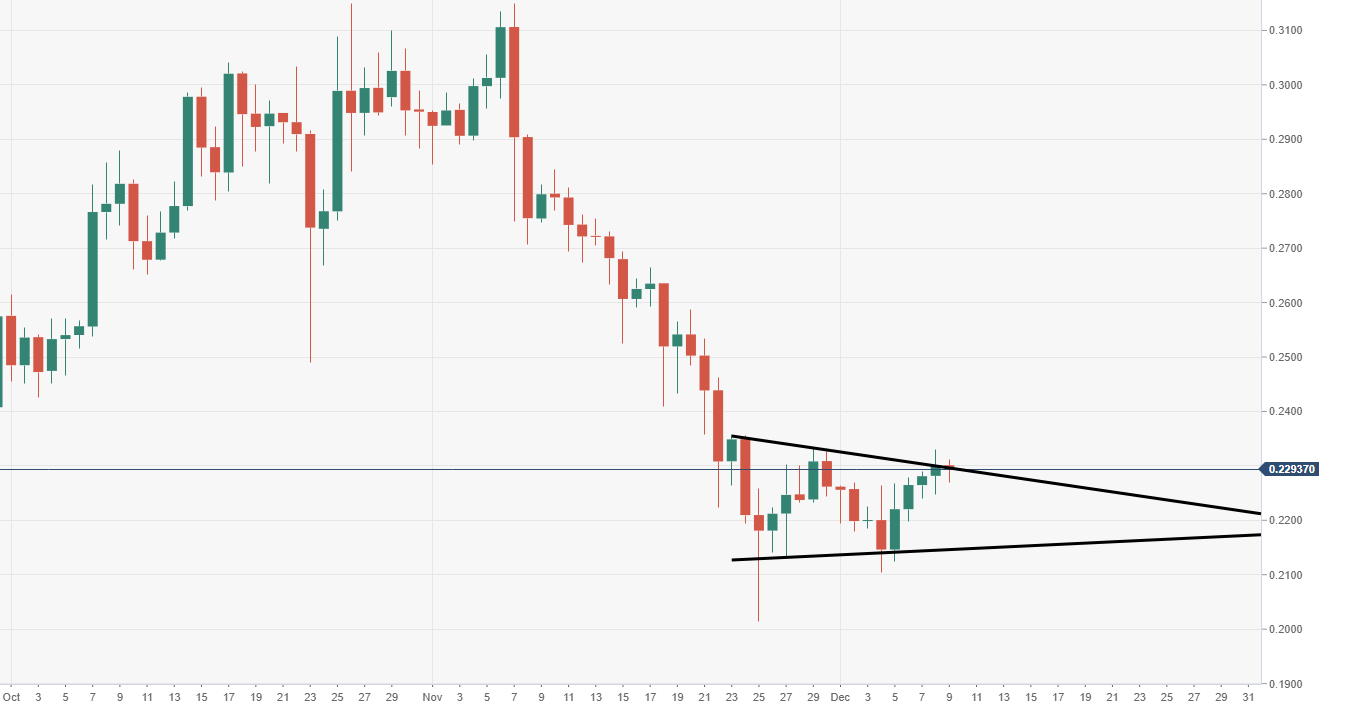
XRP/USD daily chart
Price action is stuck within a stubborn bearish pennant, breakout to the downside remains a risk.
Spot rate: 0.2290
Relative change: -0.50%
High: 0.2311
Low: 0.2272
