Home Bitcoin technical analysis: BTC/USD bearish flag dangers loom
Crypto News

Bitcoin technical analysis: BTC/USD bearish flag dangers loom

  • Bitcoin price is trading in negative territory, down some 0.50% in the second half of the session.  
  • BTC/USD price action is moving within a bearish flag structure via the daily chart.
  • The bulls must break the barrier at $7500 for recovery to continue to take place.  


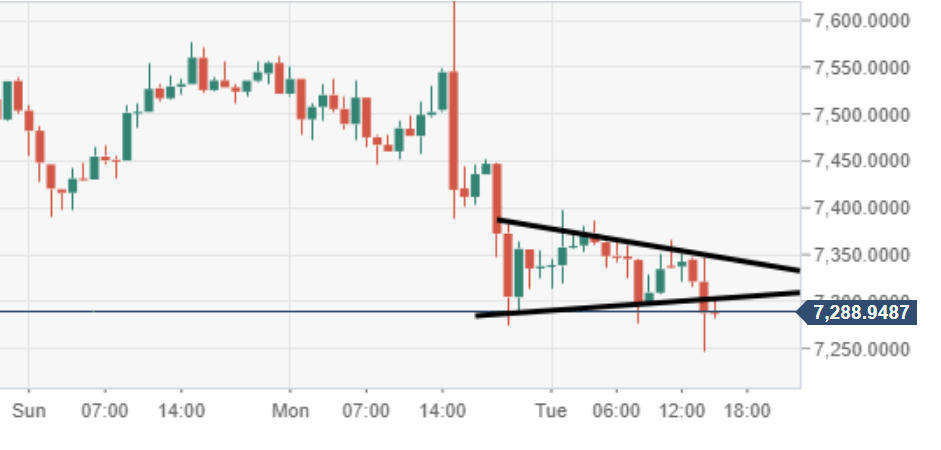
BTC/USD 60-minute chart

Price action has breached a near-term pennant structure, further pressure south eyed.  
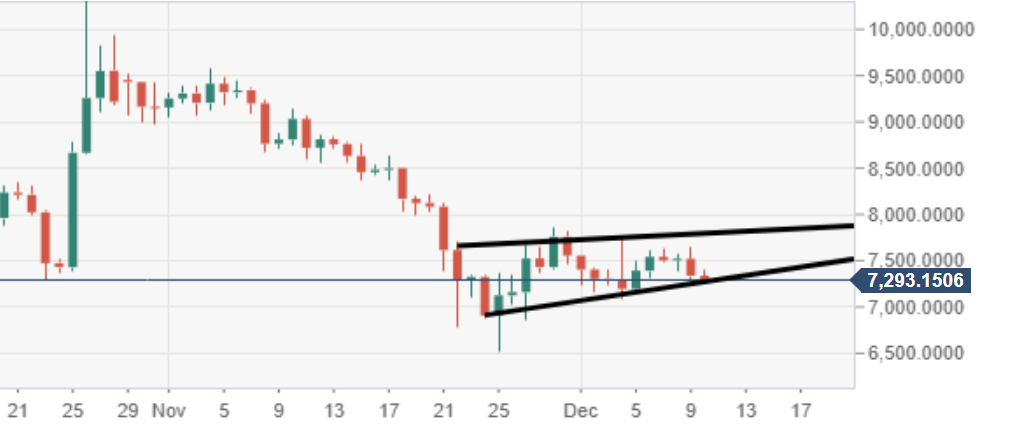


BTC/USD daily chart

A bearish flag structure can be observed via the daily, subject to a potential breakout south.  


Spot rate:                   7,387.68

Relative change:       -0.50%

High:                           7398.24

Low:                           7247.46


FX Street

FX Street

FXStreet is the leading independent portal dedicated to the Foreign Exchange (Forex) market. It was launched in 2000 and the portal has always been proud of their unyielding commitment to provide objective and unbiased information, to enable their users to take better and more confident decisions.