- XMR/USD has found support at the SMA 20 curve.
- MACD indicator shows increasing bullish momentum.
XMR/USD daily chart
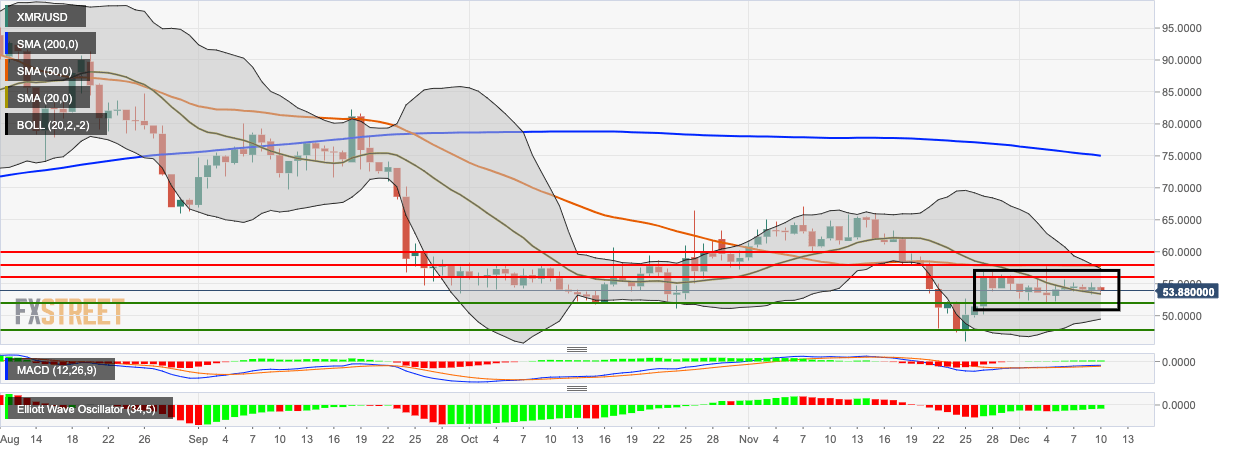
XMR/USD keeps trudging along horizontally, as the price fell from $54.50 to $53.80 and has found support on the 20-day Simple Moving Average (SMA 20) curve. The 20-day Bollinger jaw has narrowed, showing decreasing market volatility. The Moving Average Convergence/Divergence (MACD) indicates increasing bullish momentum, while the Elliott Oscillator has had six straight green sessions.
