- Strong resistance levels lie at $6,710, $6,765 and $6,810.
- BTC/USD dropped from $6,877.65 to $6,612.15 this Tuesday.
BTC/USD daily confluence detector
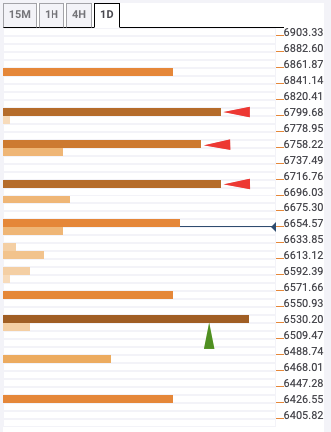
This Tuesday, BTC/USD had its second straight heavily bearish day, falling from $6,877.65 to $6,612.15. The bulls have rallied together in a desperate attempt to recover the price this Wednesday. However, the upside is capped by strong resistance levels at $6,710, $6,765 and $6,810. $6,710 has the one-day Fibonacci 38.2% retracement level and $6,765 has the one-week Pivot Point support-two and one-hour Bollinger Band middle curve. Finally, $6,810 has the 100-day Simple Moving Average (SMA 100) curve.
On the downside, healthy support lies at $6,535, which has the Previous Month low.
