- EOS/USD fell slight from $2.48 to $2.465 this Thursday.
- The MACD indicator shows us that the market momentum has shifted from bearish to bullish.
EOS/USD daily chart
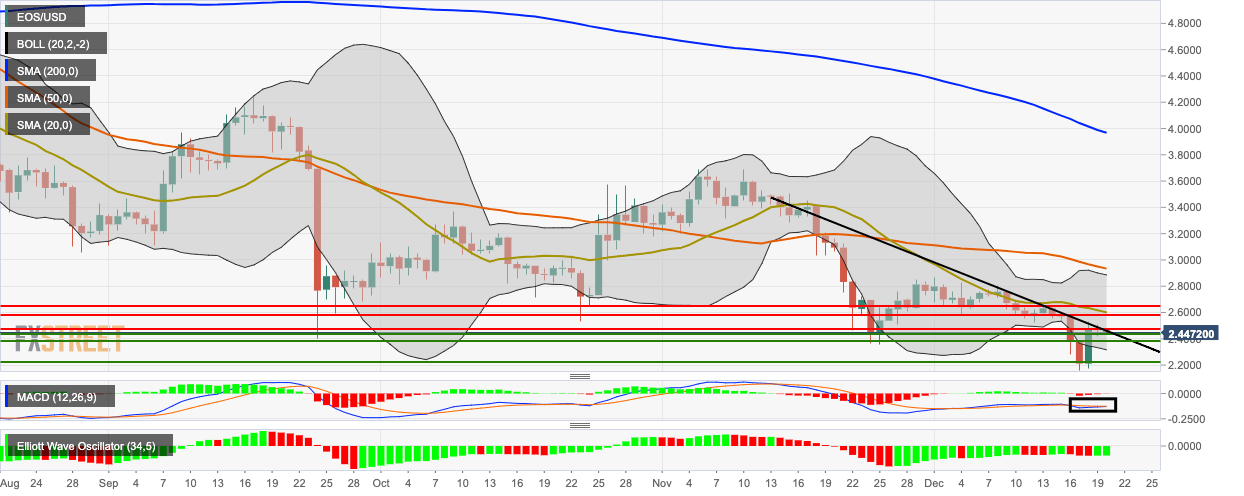
EOS/USD is on course of charting two straight bearish days. This Thursday, the price of the asset fell from $2.48 to $2.465 and has fallen further to $2.45 in the early hours of Friday. Currently, the price is sitting on the $2.45 support line and is negotiating with resistance at the downward trending line. The price is hovering below the 200-day Simple Moving Average (SMA 200), SMA 50 and SMA 20 curves. The Moving Average Convergence/Divergence (MACD) shows us that the market momentum has shifted from bearish to bullish, while the Elliott Oscillator has had two straight green sessions.
