- ETC/USD went up from $3.74 to $4.06 this Friday.
- Hourly ETC/USD is currently trending in a downwards channel pattern.
ETC/USD daily chart
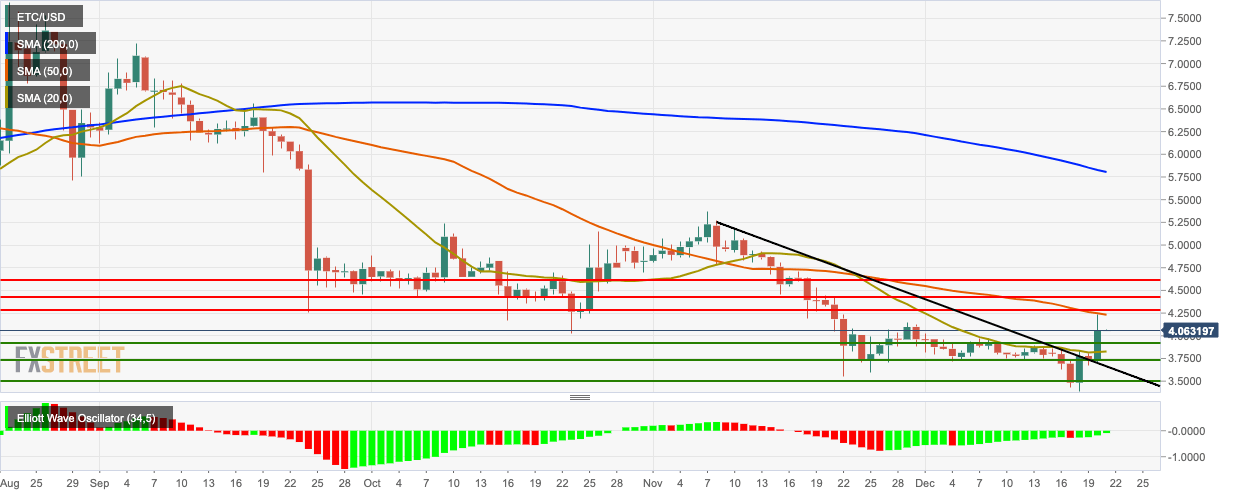
ETC/USD daily chart was able to break past the resistance provided by the downward trending line and went up from $3.74 to $4.06 this Friday. The price was able to break above the resistance provided by the 20-day Simple Moving Average (SMA 20) but was unable to do so with the SMA 50. The Elliott Oscillator has had 23 green sessions of the last 25.
ETC/USD four-hour chart
-637124868875733617.png)
The four-hour ETC/USD chart has found support at the upward trending line. The price broke above the green Ichimoku cloud and the 200-day Simple Moving Average (SMA 200) curve. Currently, the price has found resistance at the $4.12 line. The Moving Average Convergence/Divergence (MACD) indicates increasing bullish momentum.
ETC/USD hourly chart
-637124869483877380.png)
ETC/USD was able to break above the 20-day Bollinger Band, indicating that it was overpriced. This corroborated by the fact that the Relative Strength Index (RSI) was hovering deep within the overbought (green) zone. However, the bears soon made a comeback, as evident by the downward channel pattern. The price re-entered the Bollinger band and the RSI indicator fell to 64, below the overbought zone.
