- Ethereum price is trading in the red by some 0.15% in the session on Tuesday.
- ETH/USD price action gave up a run of four consecutive days in the green, following closure in the red on Monday.
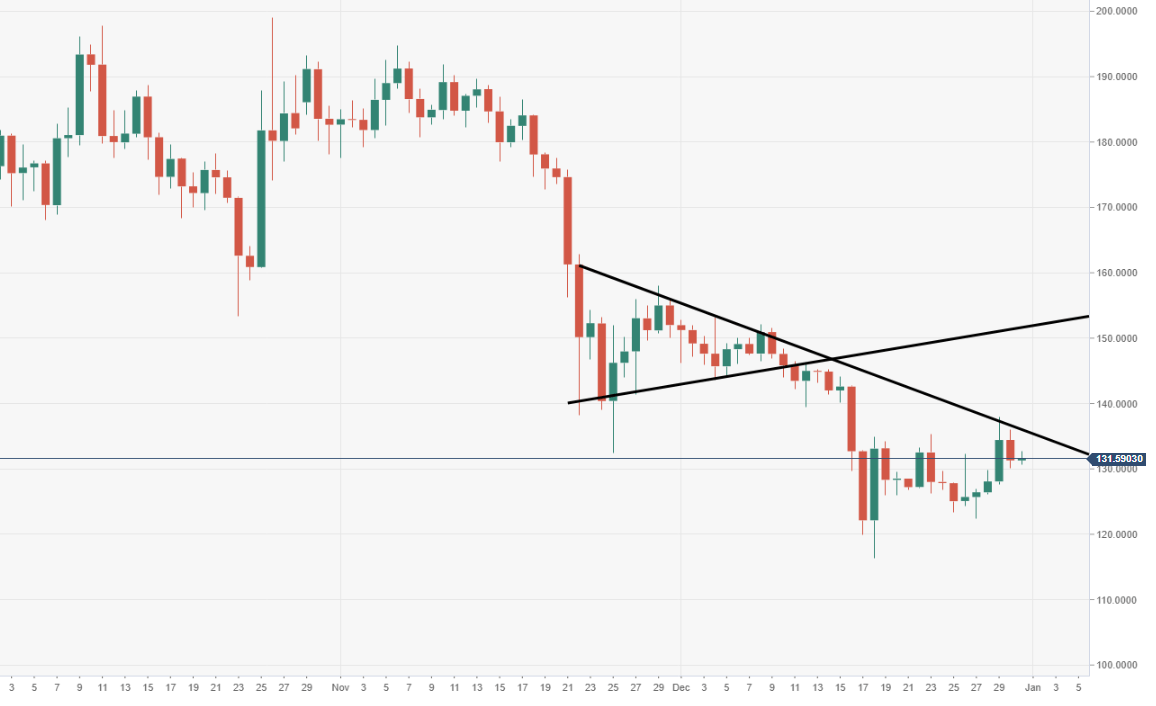
- The price has been punished by a trailing descending trend line, forcing the bears to come back into play.
ETH/USD daily chart
A rejection was seen at a descending trend line, which was part of a breached bearish pennant.
ETH/USD 60-minute chart
Near-term price action is moving within a bearish pennant structure, subject to a potential breach.
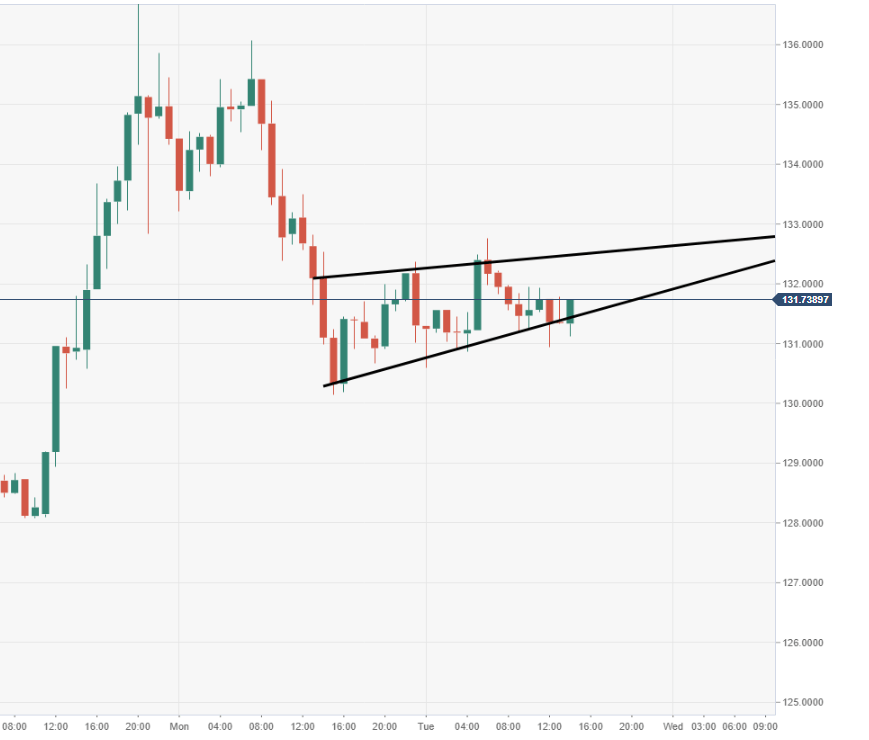
Spot rate: 131.62
Relative change: -0.15%
High: 132.75
Low: 130.60
