- Bitcoin price is trading in the green, up some 2.50% in the second half of the session.
- BTC/USD bulls are maintaining momentum to the upside, running at four consecutive days in the green.
- A break down of the barrier seen at $7500, could open the door to greater buying pressure.
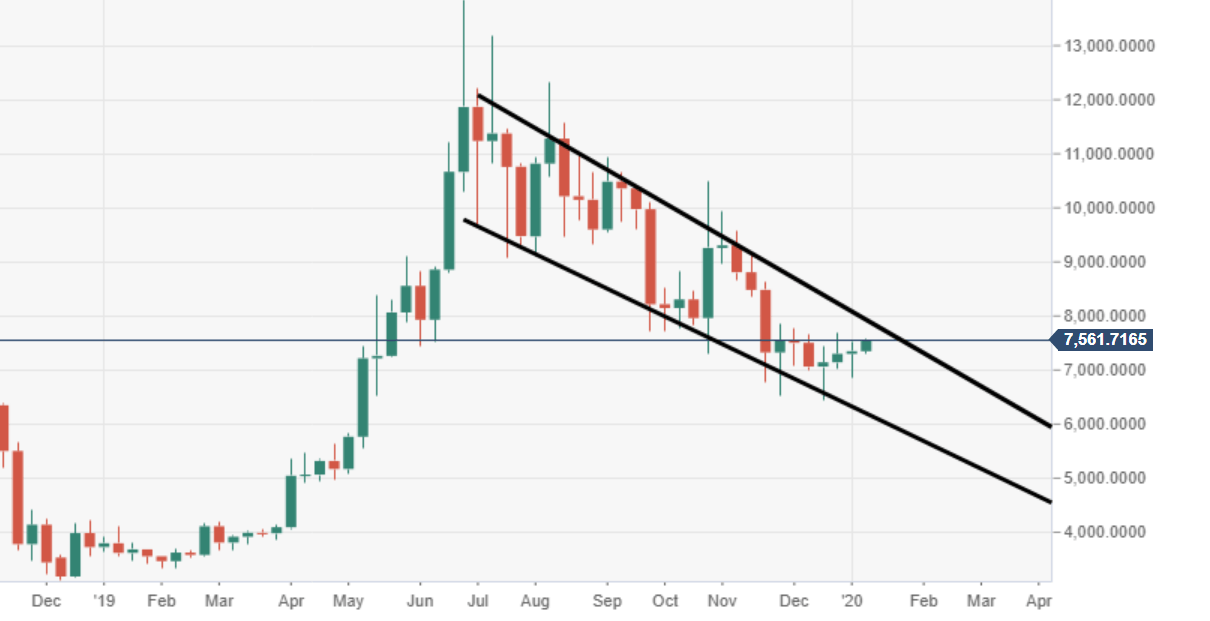
BTC/USD weekly chart
Bitcoin managed to force another closure in the green for the week, running towards its fourth consecutive.
BTC/USD daily chart
Bulls are tackling the $7500 barrier, which has proven to contain the price since the back-end of November. A break above could prove to be critical for further bull momentum.
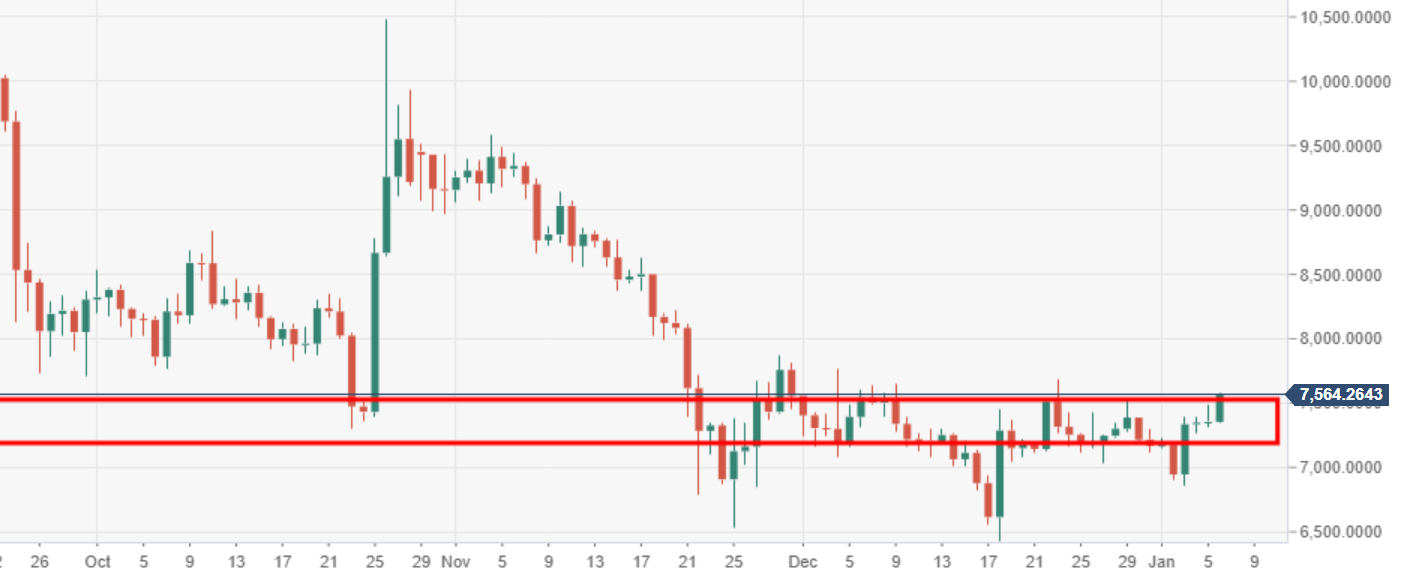
Spot rate: 7560.72
Relative change: +2.50%
High: 7578.59
Low: 7342.68
