- Bitcoin price is trading in the red, down some 1.80% in the second half of the session.
- BTC/USD bulls have lost momentum for now, as the price runs towards its second consecutive session in the red.
- The next significant level of support is eyed at $7600, which had previously capped upside.
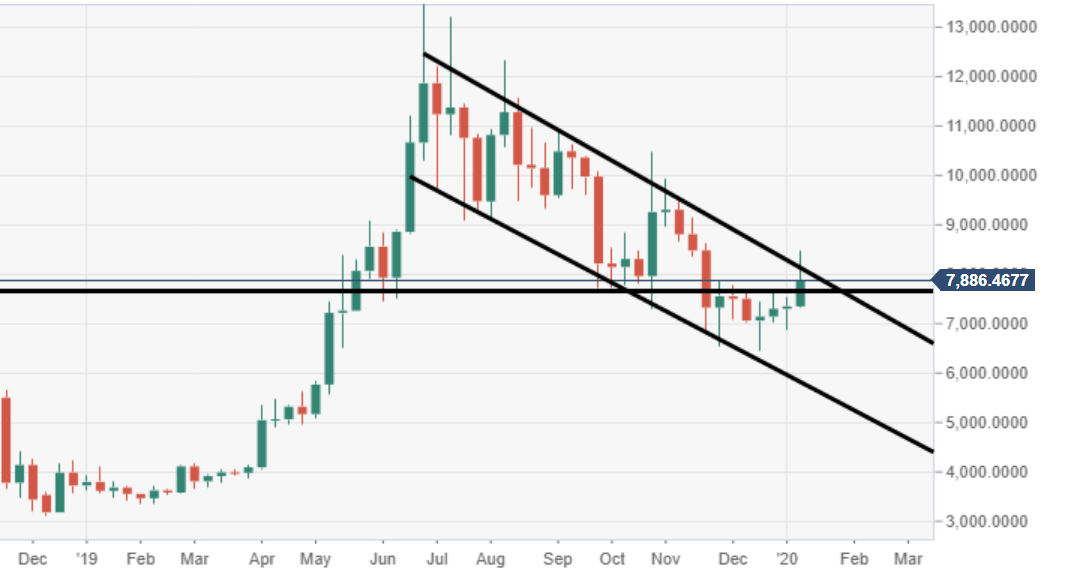
BTC/USD weekly chart
The price via the weekly chart view continues to move within a bullish flag structure. BTC recently was rejected by the upper descending trend line.
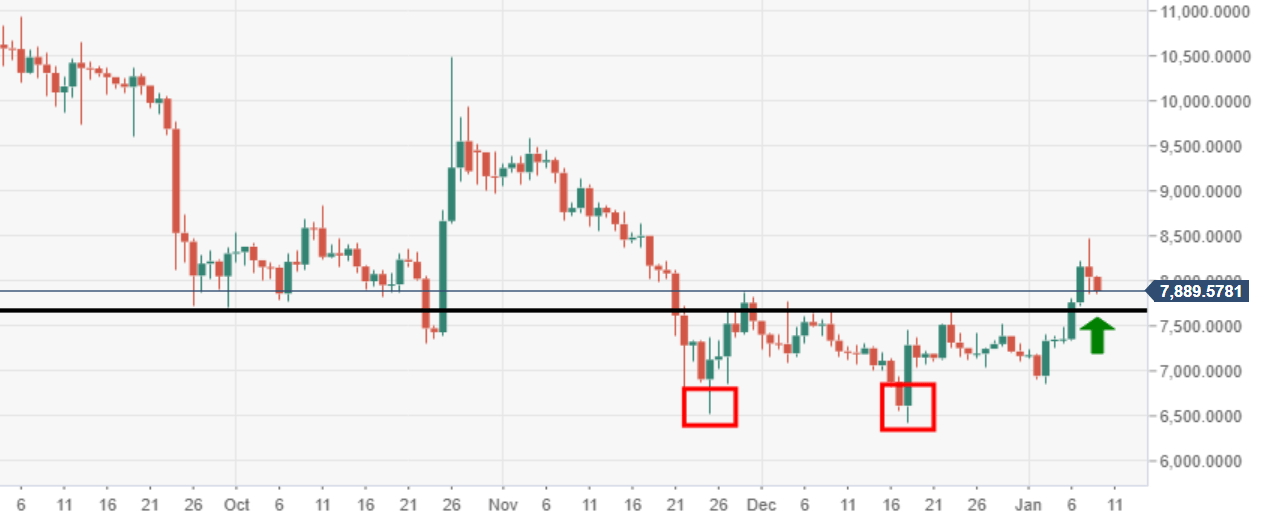
BTC/USD daily chart
Price action via the daily chart view had formed a double bottom formation, the neckline is subject to a retest at $7600.
Spot rate: 7,904.06
Relative change: -1.80%
High: 8047.20
Low: 7854.84
