- ETH/USD went up from $137.85 to $144.75 this Friday.
- The RSI indicator is trending around the neutral zone.
ETH/USD daily chart
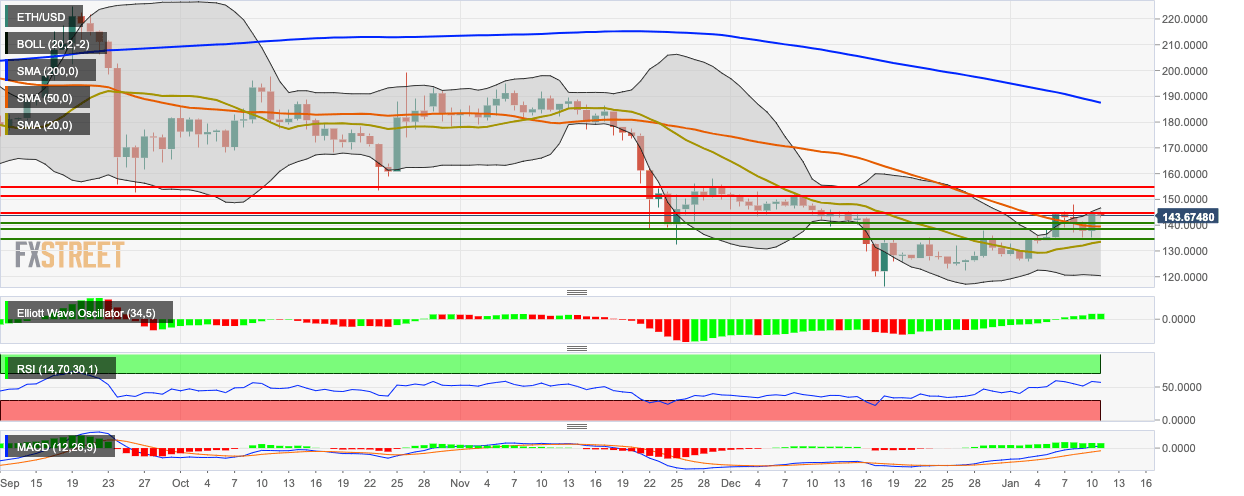
ETH/USD bears stepped in to correct the price following a bullish Friday, where the price of the asset went from $137.85 to $144.75. Currently, the price has dropped a bit to $143.50. As per technical analysis, the price encountered resistance at the upper curve of the 20-day Bollinger Band and fell down. This Friday, the price was able to overcome resistance at the 50-day Simple Moving Average (SMA 50) curve. The Elliott Oscillator has had 15 straight green sessions, which along with the Moving Average Convergence/Divergence (MACD), shows sustained bullish sentiment. The Relative Strength Index (RSI) indicator is trending around the neutral zone, hinting that we may be going through a price consolidation phase.
