- Strong support for Bitcoin seems to have formed near $8000 handle.
- Near-term outlook remains bullish with daily RSI inching higher above 60.
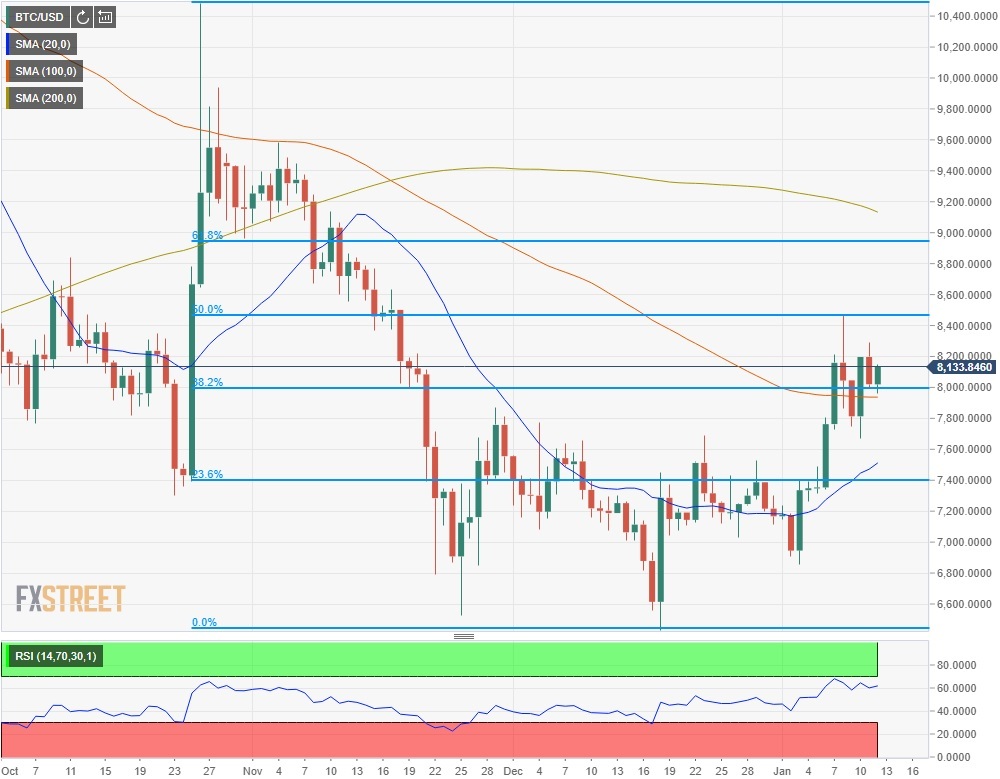
Bitcoin (BTC/USD) lost more than 2% on a daily basis on Saturday and erased almost half of the gains it registered on Saturday. However, with the trading volume staying thin, the pair didn’t have a difficult time finding support near the critical $8000 handle. As of writing, the pair was up 1.25% on the day at $8115.
The lack of significant fundamental drivers surrounding the cryptocurrency market suggests that Bitcoin is making technical movements.
Technical outlook
On the daily chart, the Relative Strength Index (RSI) has stayed above the 60 mark following Saturday’s pullback and started to edge higher on Sunday, suggesting that the bullish momentum is picking up steam. Additionally, Bitcoin closed the third straight day above the 100-day moving average (MA) to compliment the view that the leading cryptocurrency is likely to remain bullish in the short-term.
Bitcoin could encounter first resistance at $8400-8500 area (Fibonacci 50% retracement of October 26 – December 17 drop/January 8 high) before targeting $8900-9000 area (Fibonacci 61.8% retracement of October 26 – December 17 drop/psychological level). On the downside, a decisive breakthrough $8000 (Fibonacci 50% retracement of October 26 – December 17 drop/100-day moving average) could trigger a deeper selloff and drag Bitcoin lower toward $7650 (January 10 low) and $7500 (20-day moving average).
Bitcoin daily chart