- Bitcoin Cash price is trading in the red, with losses of 1.30% in the second half of the session.
- BCH/USD bulls are demonstrating strong signs of a further recovery to come.
- The price is moving within a descending channel structure via the weekly, subject to a breakout.
BCH/USD weekly chart
The bulls are pressing further to the north, after another weekly closure in the green, running towards its potentially fourth.
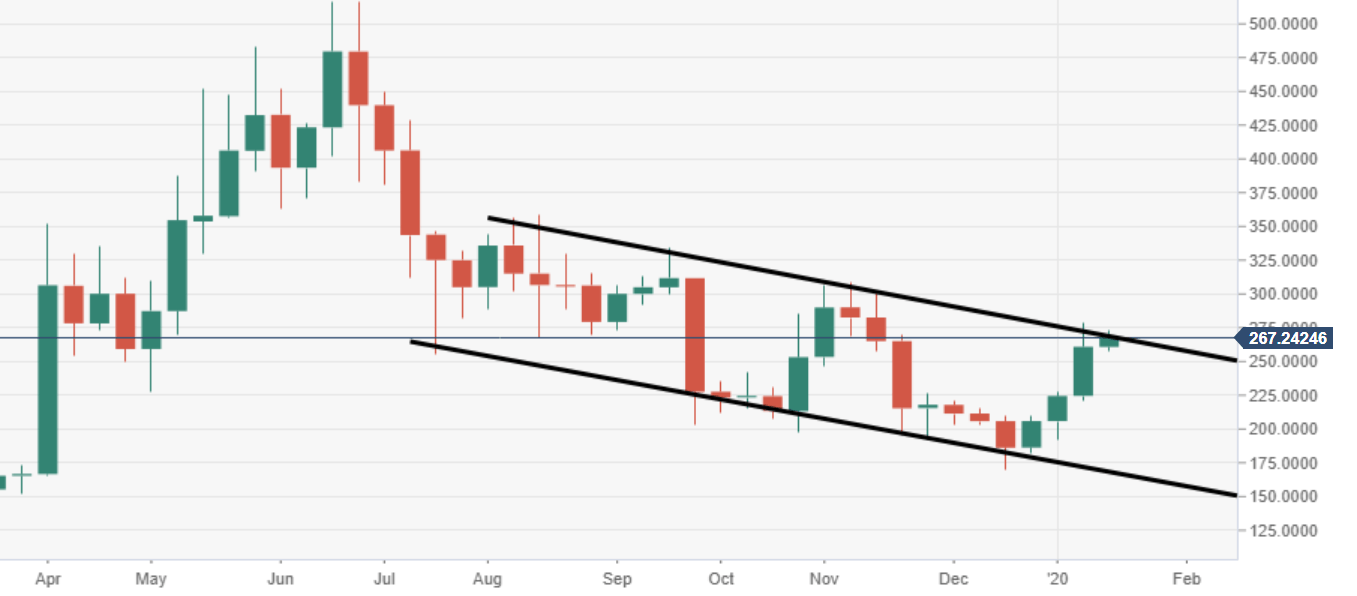
BCH/USD daily chart
Price action is capped to the upside by a descending trend line of resistance, which has been in play since 6 August.

Spot rate: 265.40
Relative change: -1.30%
High: 272.82
Low: 260.87
