- ETH/USD has been recovering from this week’s low.
- The pivotal resistance is created by SMA200 on a daily chart.
Ethereum, the second-largest digital asset with the current market value of $18.5 billion, bottomed out at $161.11 on January 20 and has been gaining ground ever since. The coin has gained over 1% on a day-to-day basis and stayed mostly unchanged since the beginning of Wednesday. ETH/USD attempted a rise above $171.00, but the move proved to be unsustainable and the coin slipped back below $170.00 level.
ETH/USD: technical picture
On the intraday chart, Ethereum has been moving inside an upward channel with the lower boundary created by SMA200 1-hour. Currently, this MA comes att $165.75 and serves as strong short-term support for the price. Once it is taken out, the sell-off may be extended towards the next barrier, created by this week’s low at $161.11 and followed by a psychological $160.00. If it is broken. SMA100 daily at $157.75 will come into focus. This development will worsen the technical picture and bring more bears to the market.
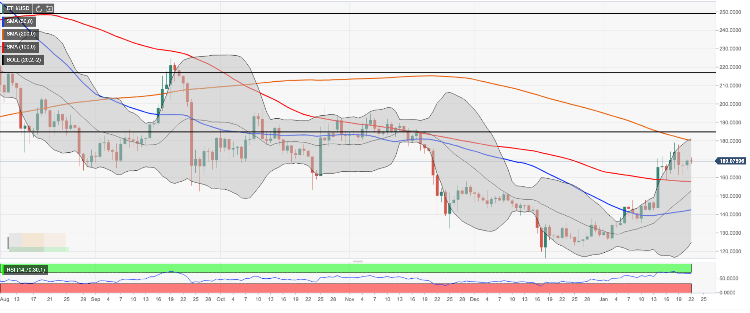
On the upside, the first target is $170.00. We will need to see a sustainable move above this level for the upside to gain traction and take the price to the intraday high of $171.00. The next resistance awaits ETH bulls on approach to $172.50 (the upper line of 4-hour Bollinger Band); however, the vital resistance comes at $180.00. This area is reinforced by SMA200 daily and the upper line of daily Bollinger Band.
ETH/USD daily chart