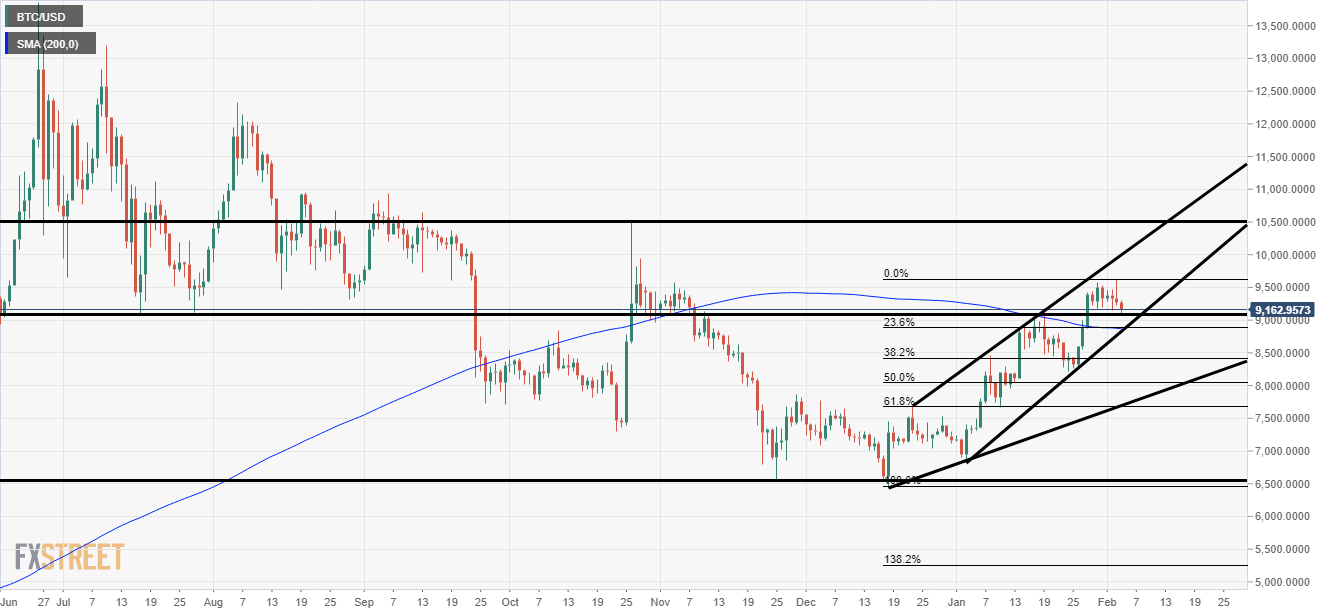
- Bitcoin is nearing a support zone where the SMA, Fibonacci and previous wave all confluence.
- The price of BTC/USD is 1.20% lower on Tuesday after a great run recently.
BTC/USD Daily Chart
BTC/USD has moved into a pretty nice channel on the daily chart below.
But now that the price has started to retrace where could we find support?
The 9K level is a significant one and there are lots of key technical points in close proximity.
The 23.6% Fibonacci retracement is pretty close and the 200 daily SMA is just under the 9K level.
Lastly, the bottom of the channel is also there and could act as support.
Additional Levels

