- IOT/USD breaks above the upward channel formation.
- RSI indicator is trending around 84.375 inside the overbought zone.
IOT/USD daily chart
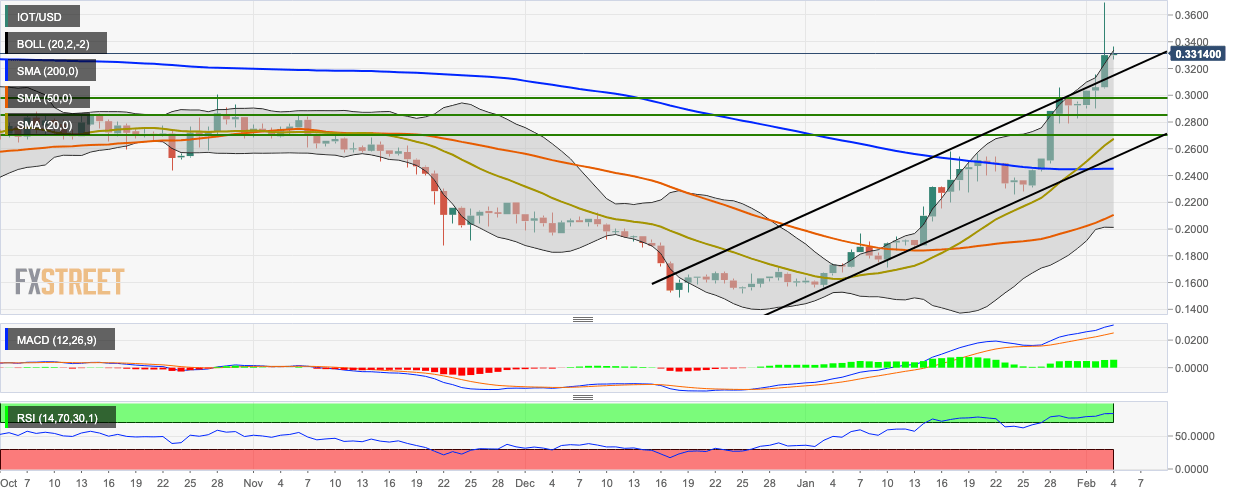
IOT/USD bulls have retained control over the market for four consecutive days. IOT/USD was trending in an upward channel formation before this Monday’s bullish action pushed the price above the channel. IOT/USD went up from $0.329 to $0.332 and is flirting with the upper curve of the 20-day Bollinger Band. The RSI indicator is trending around 84.375 inside the overbought zone so that a bearish correction may be round the corner.
The primary reason behind IOT/USD’s rise happens to be the release of version 0.1.0 of the Coordicide alphanet. The main features of this release are:
- Autopeering: Automatic peer discovery and distance-based neighbor selection.
- Gossip: Sending and receiving new transactions via a network layer.
- Rate control: The rate control will limit transaction issuance.
- API: This interface will help you to send data (0 value) transactions and query the Tangle.
