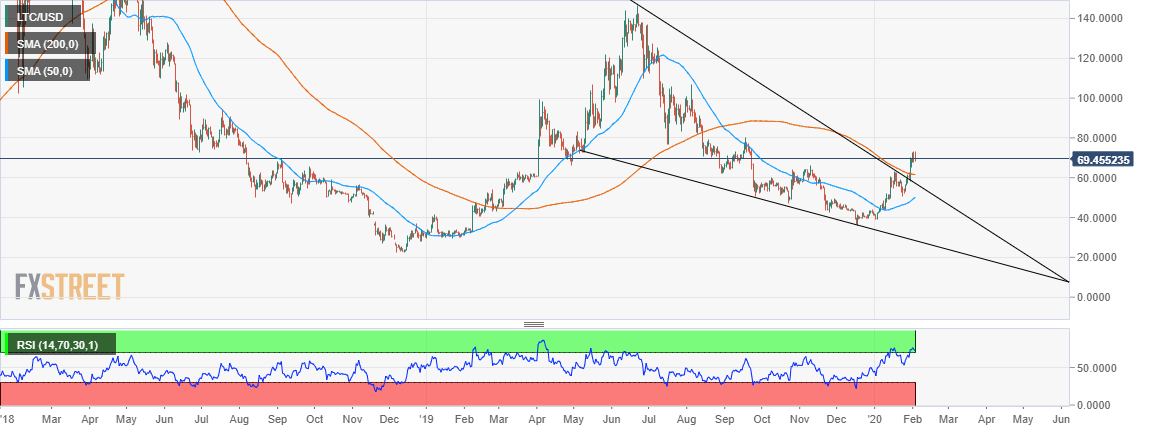
- Litecoin bulls hold on to the mantle in spite of the rejection at $75.
- Litecoin higher high and lower high pattern narrows into a rising wedge pattern; signaling a possible breakdown.
Spot rate: $69.45
Relative change: -0.3882
Percentage change: -0.56
Trend: Short term bullish bias
Volatility: Shrinking
LTC/USD daily chart
Following the incredible recovery from lows traded in December, Litecoin pushed for a massive breakout above a falling wedge pattern.
The narrowing gap between the 200SMA and the 50 SMA hints that technicals could continue to align for another massive breakout towards $100.
LTC/USD 4-hour chart
Short term analysis suggests unless the resistance at $75 is broken, a reversal could be imminent.
The 50 SMA at $65 and the 100 SMA at 54.67 are in line to stop declines in the case a reversal ensues.

-637163825112984267.png)
