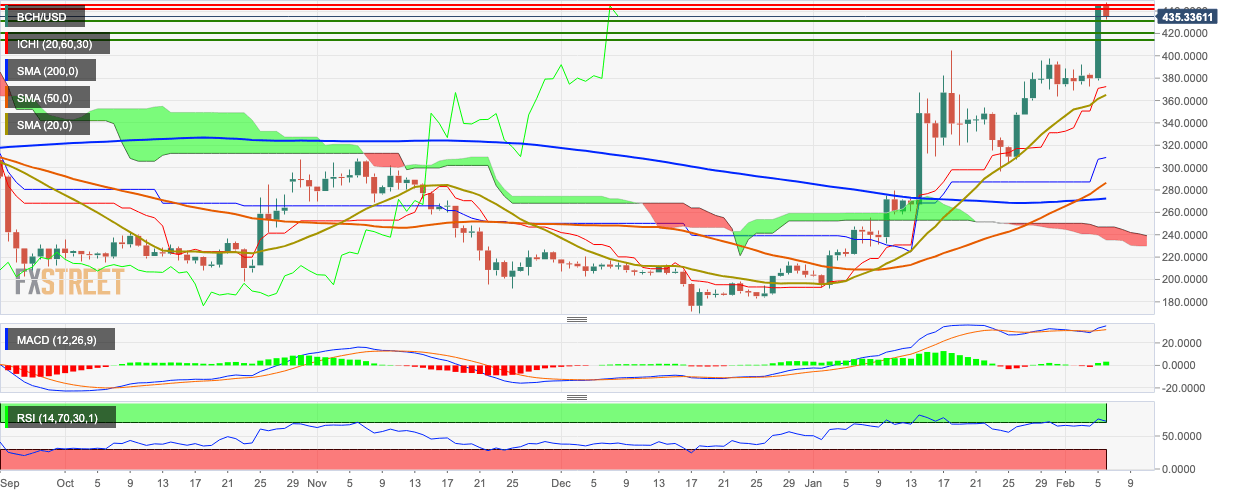
- BCH/USD spiked up from $380.55 to $444.75 this Wednesday.
- RSI indicator fell from 78.15 to 72.65 following bearish correction.
BCH/USD daily chart
BCH/USD bears stepped in to correct the market following a heavily bullish Wednesday. This Wednesday, the price of the asset rose from $380.55 to $444.75, which has since corrected to $434.85 in the early hours of Thursday. The price is hovering above the red Ichimoku cloud, SMA 20, SMA 50 and SMA 200. The RSI indicator went up to 78.15, showing that BCH/USD had become overpriced. This Thursday’s bearish correction dropped the RSI down to 72.65. The MACD indicator shows increasing bullish market momentum.

