- Bitcoin price is trading in negative territory, up 0.10% in the second half of the session.
- BTC/USD bulls failed to keep hold of the $10,000 price mark for now.
- Sellers continue to lurk in and around the psychological $10,000 area, after hitting since October 2019.
BTC/USD weekly chart
The price managed to produce another week in the green, marking its second consecutive. BTC bulls have been running from $6500 up to recent highs above $10,000, over eight weeks.

BTC/USD daily chart
Critical daily demand should be noted at the range of $9750-500, former acting resistance.
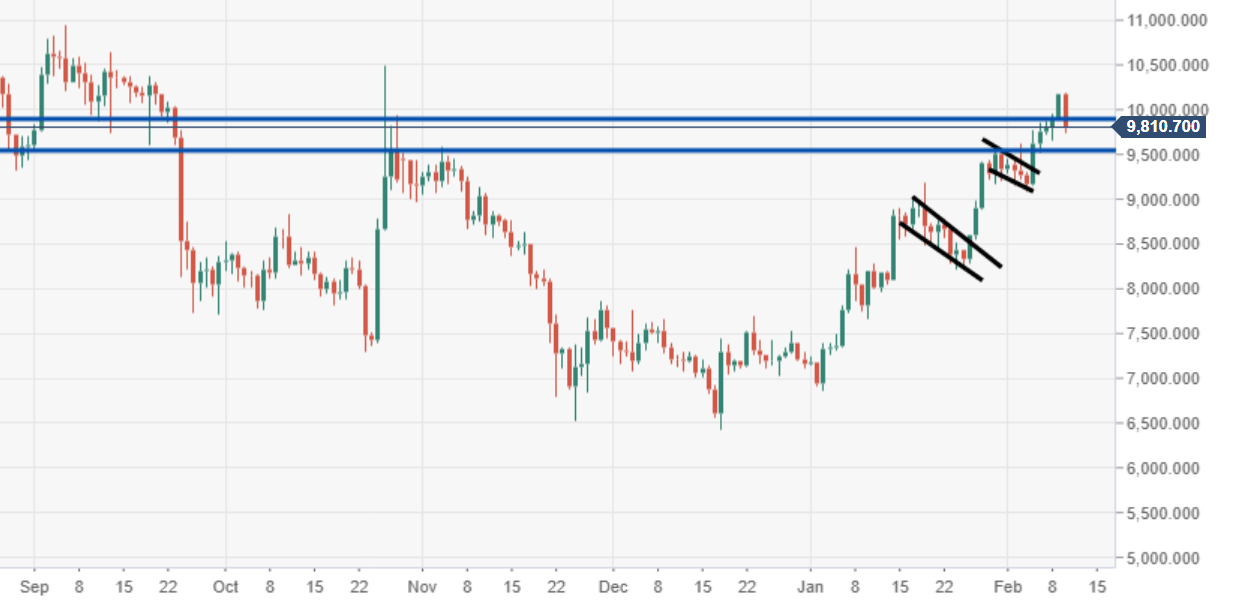
Spot rate: 9810.21
Relative change: -3.50%
High: 10,195.75
Low: 9744.70
