- Bitcoin price is trading in positive territory, up 0.80% in the second half of the session.
- BTC/USD bulls enjoyed a strong move in the prior session, making themselves comfortable within $10,000.
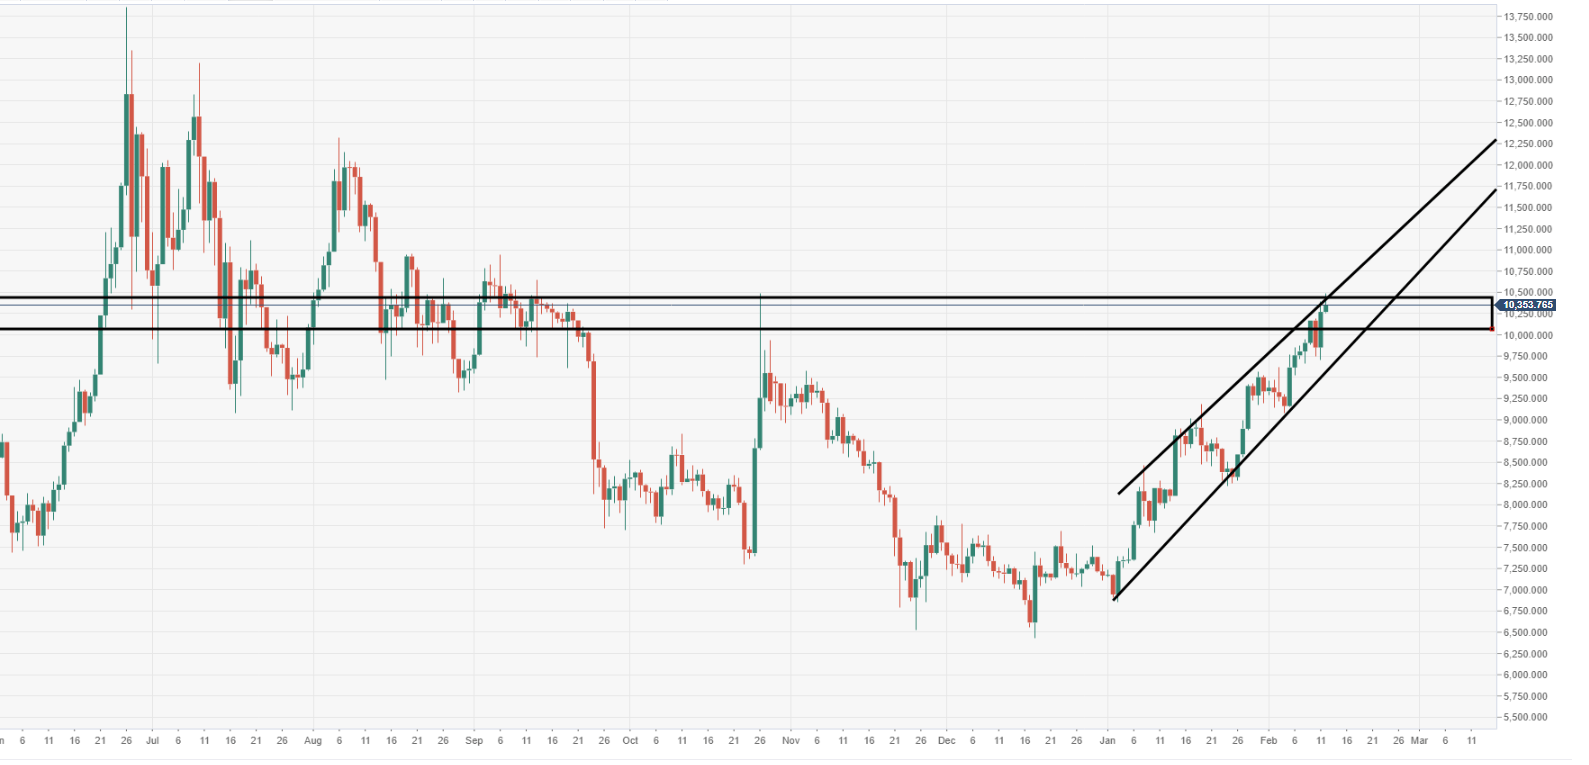
- A critical barrier of resistance observed at $10,500, a break down should invite a decent wave of upside momentum.
BTC/USD daily chart
The bulls are testing $10,500, where the price last topped on 26 October, before being forced back to the downside.
BTC/USD 60-minute chart
A near-term ascending trend line can be observed via the 60-minute chart view, propping up the price a minor pullback. However at risk of falling to the downside, given rising channel structure.

Spot rate: 10,353.33
Relative change: +0.80%
High: 10,249.70
Low: 9707.95
