- The RSI indicator is trending around 82 in the overbought zone.
- Both the MACD indicator and Elliott Oscillator shows sustained bullish sentiment.
XRP/USD daily chart
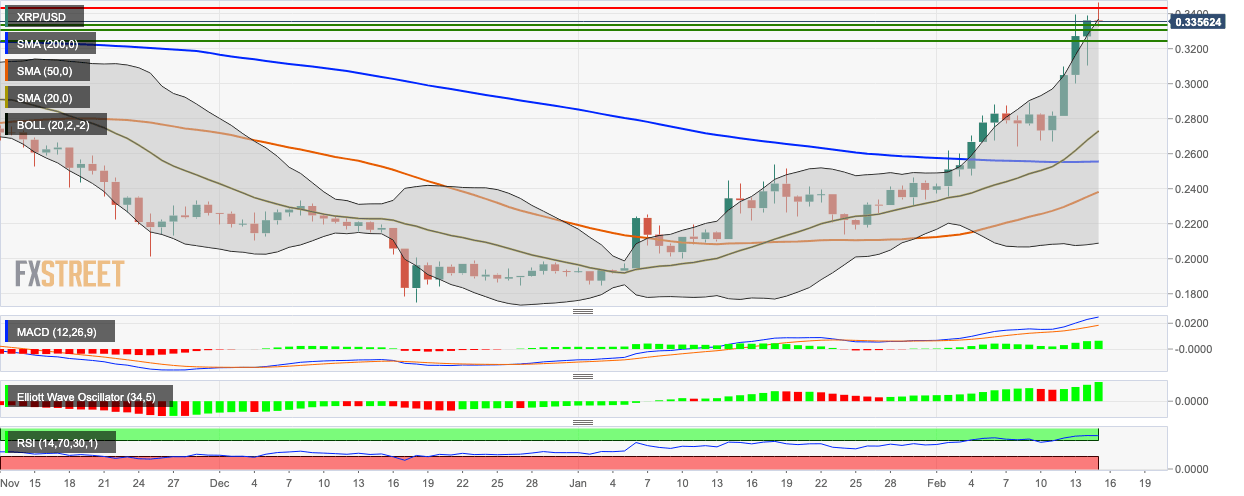
XRP/USD bears seem to have taken control following four straight bullish days. In the early hours of Saturday, XRP/USD is trading for $0.336. The price is currently sitting on top of the upper curve of the 20-day Bollinger Band and the RSI indicator is trending around 82 in the overbought zone. Both these indicators show that the price is currently overpriced and hence more bearish action could be expected. However, the overall market sentiment remains bullish, as seen from the MACD indicator and Elliott Oscillator. Ideally speaking, the bulls will want to gain even momentum to break past the resistance at $0.3436-level to continue its upward movement.
