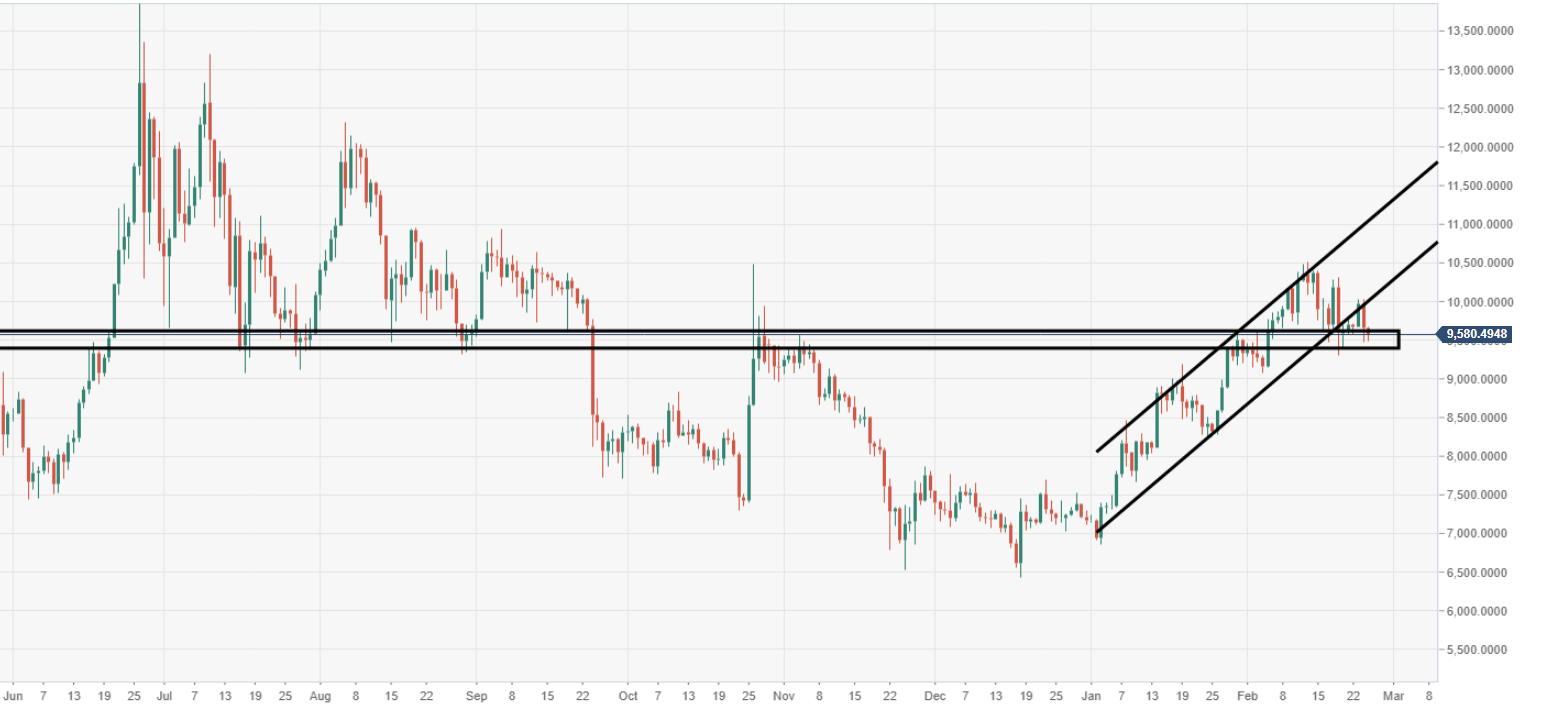
- Bitcoin price is trading in negative territory, down 0.70% in the second half of the session.
- BTC/USD is at risk to another wave of downside pressure, following ascending channel breakout.
- Critical daily support should be noted around the $9500-400 price area.
BTC/USD daily chart
The price is flirting with a game=changing area, $9500-400. Failure to hold could prove to be very punishing for BTC.
BTC/USD 60-minute chart
The significance of the above-noted support range can be seen via the 60-minute, as an important zone of support.
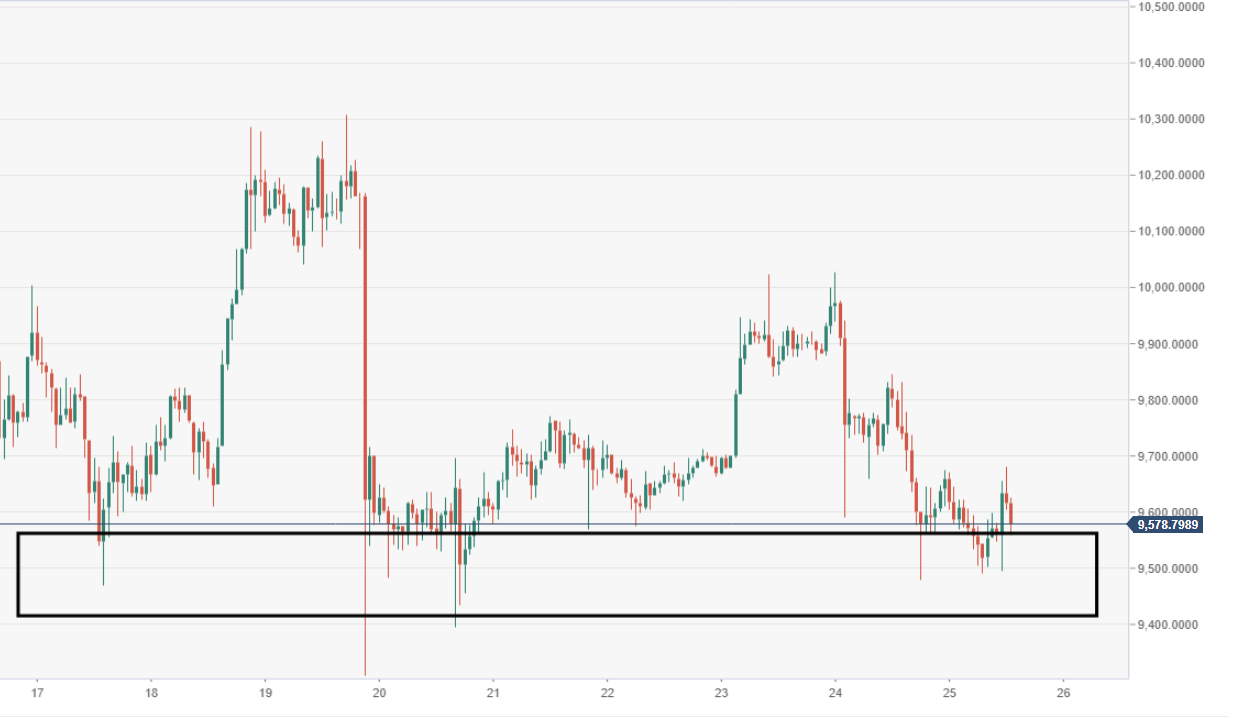
Spot rate: 9585.75
Relative change: -0.75%
High: 9680.16
Low: 9490.57
