- XMR/USD fell from $41.295 to $38.32 this Monday.
- The RSI indicator has gone up from 34.10 to 42.38 following Tuesday’s bullish price action.
Key Levels
- Current Price: $44.107
- High: $44.4732
- Low: $37.6818
- R3: $53.2817
- R2: $48.8775
- R1: $46.4904
- PP: $42.0861
- S1: $39.6990
- S2: $35.2948
- S3: $32.9077
XMR/USD daily chart
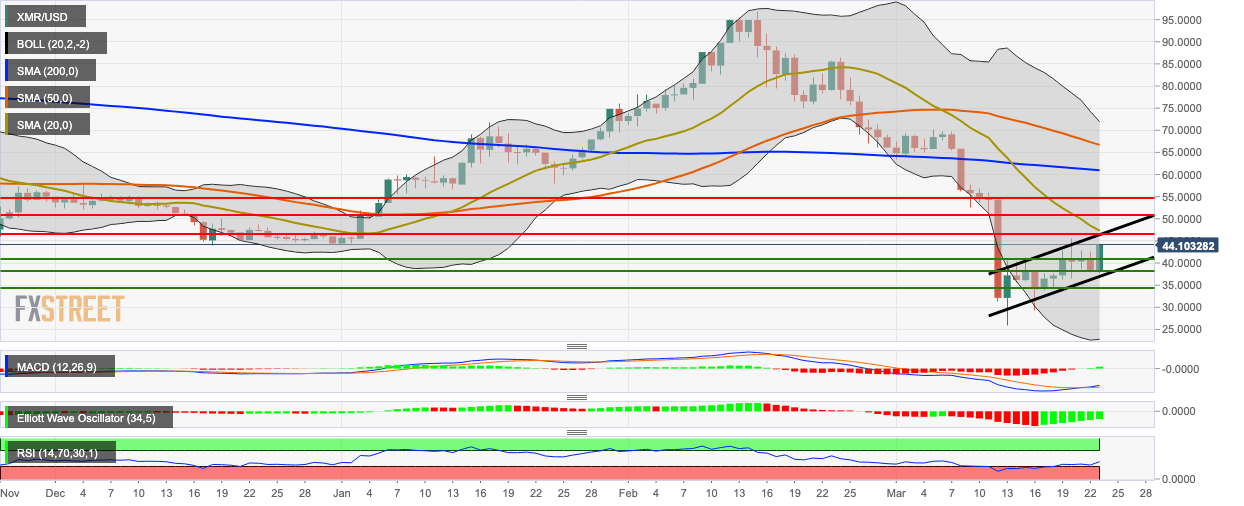
XMR/USD bulls staged a momentous comeback as the price spiked from $38.32 to $44.10. In the process, they managed to completely negate this Monday’s price action, wherein XMR/USD fell from $41.295 to $38.32. The Elliott Oscillator and MACD indicator both show increasing buyer sentiment. The RSI indicator has gone up from 34.10 to 42.38 following Tuesday’s bullish price action. ‘
XMR/USD daily price is currently trending in an upward channel formation. If the buyers want to continue upward momentum, they’ll need to break past resistance at the SMA 20 curve.
