- Bitcoin Cash price is trading in the red, with losses of 3.50% in the second half of the session.
- BCH/USD continues to be at risk of another fall, given bearish flag structure via the daily.
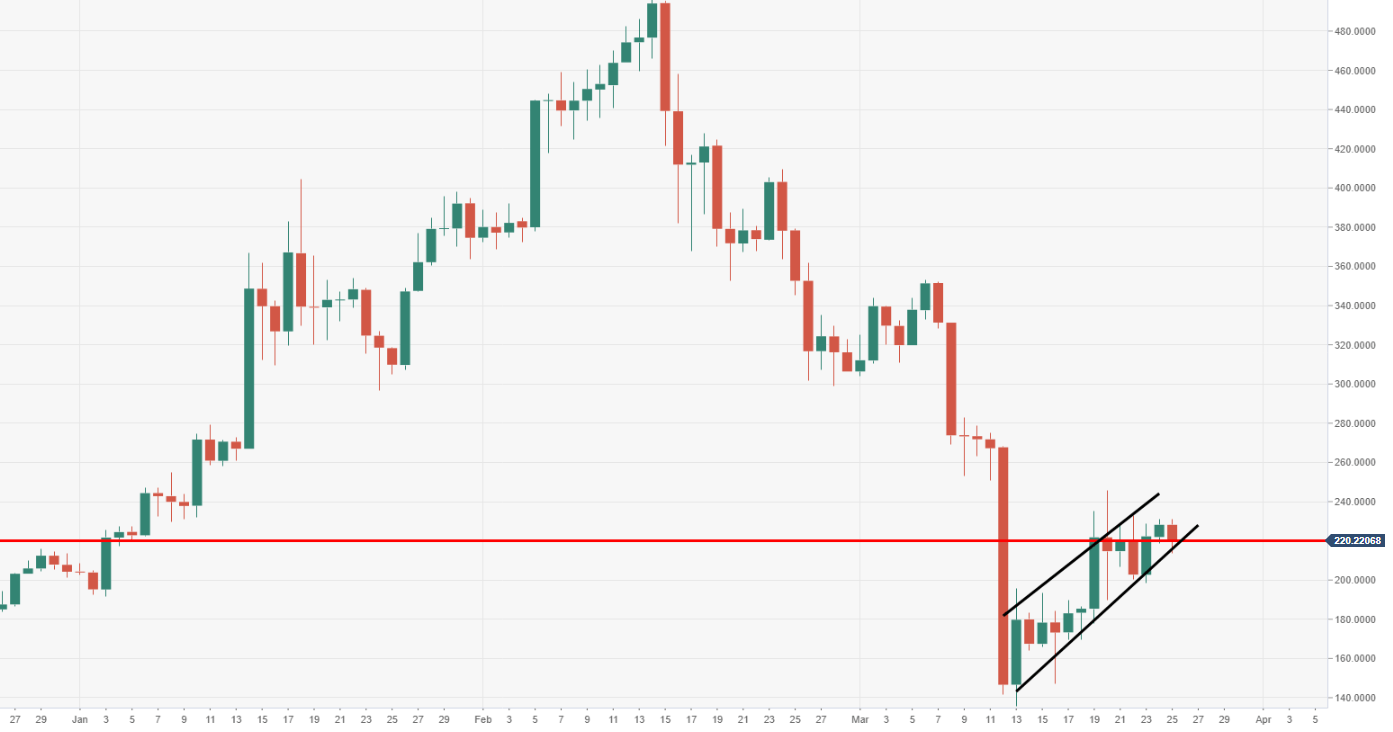
- There is still much supply within the region of $225-50 that the bulls will need to break down.
BCH/USD daily chart
The daily candle closed above a barrier that had been capping upside for five sessions, this was seen at $220. However, a retest is being observed at the time of writing.
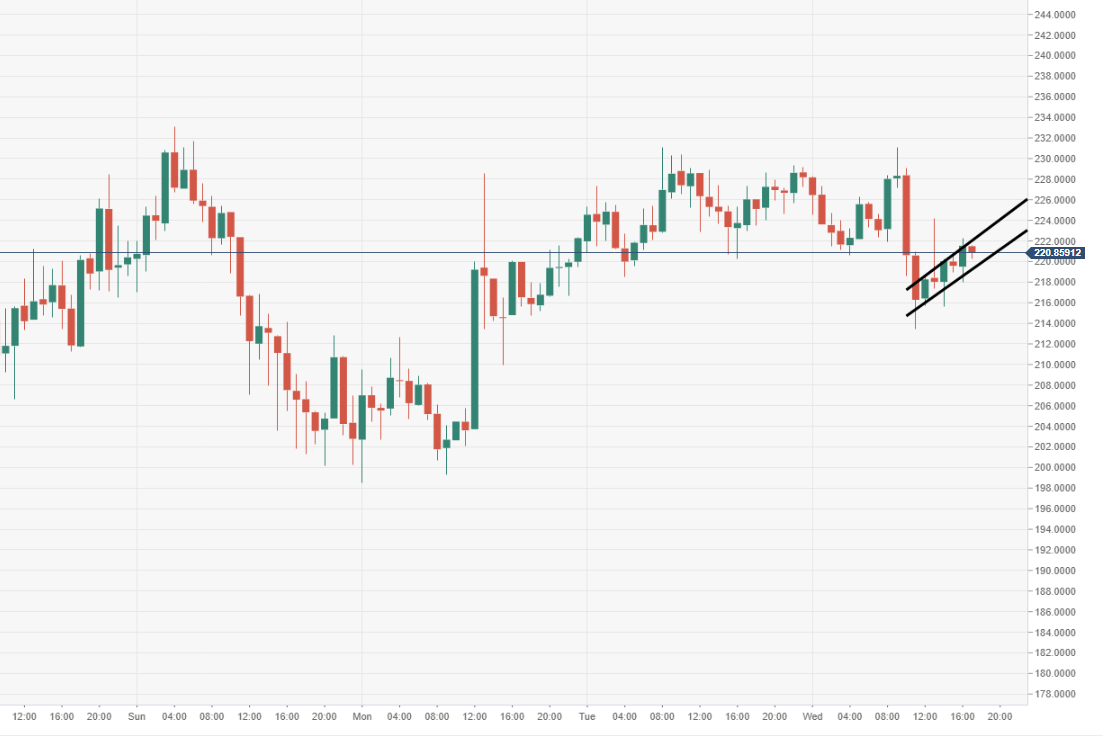
BCH/USD 60-minute chart
Price action is narrowing via the 60-minute chart view, is moving within a bearish flag structure, subject to a breach.
Spot rate: 220.78
Relative change: -3.20%
High: 231.08
Low: 213.47
