- Bitcoin price is trading in negative territory, down 7.50% in the second half of the session.
- The bulls extended to the upside following a pennant breakout, providing further momentum.
- Despite the push north, there is still somewhat a risk to the downside, given a bearish flag structure.
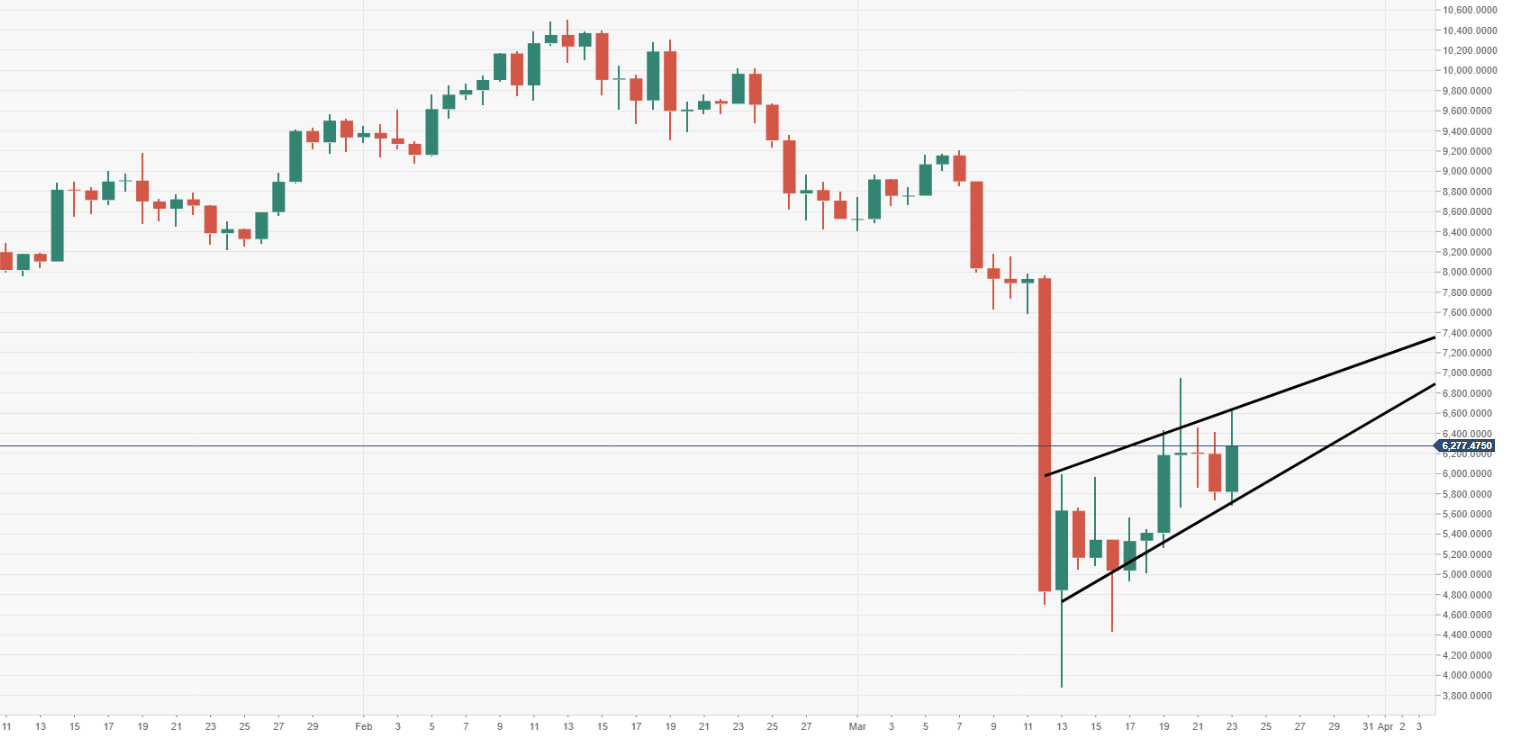
BTC/USD daily chart
The bulls made a critical breakout and closure above $6500, which was a barrier that had been capping upside for a few sessions.
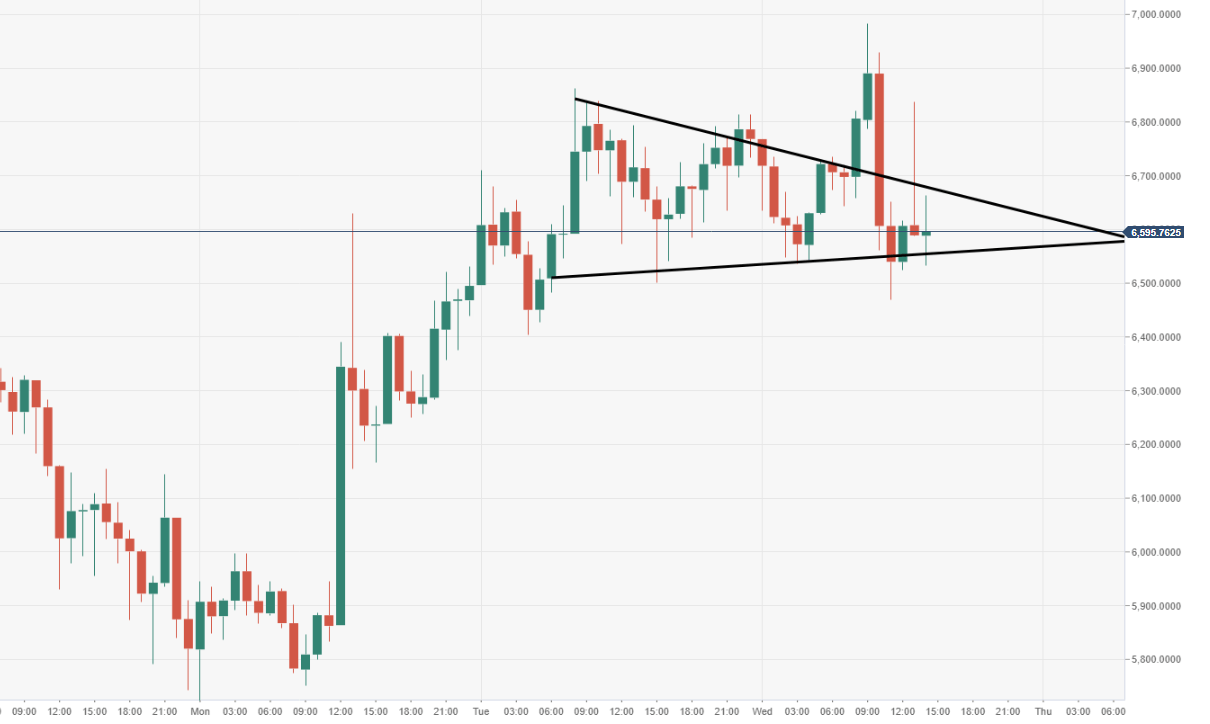
BTC/USD 60-minute chart
Bulls have a near-term opportunity to break free to the upside from a bullish pennant structure via the 60-minute chart view.
Spot rate: 136.05
Relative change: -2.15%
High: 6983.79
Low: 6469.17
