- Bitcoin price is trading in negative territory, down 2.00% in the second half of the session.
- The price managed to avoid a negative weekly closure, finishing broadly flat.
- A chunky barrier at the $7000 price mark remains a problem for the bulls.
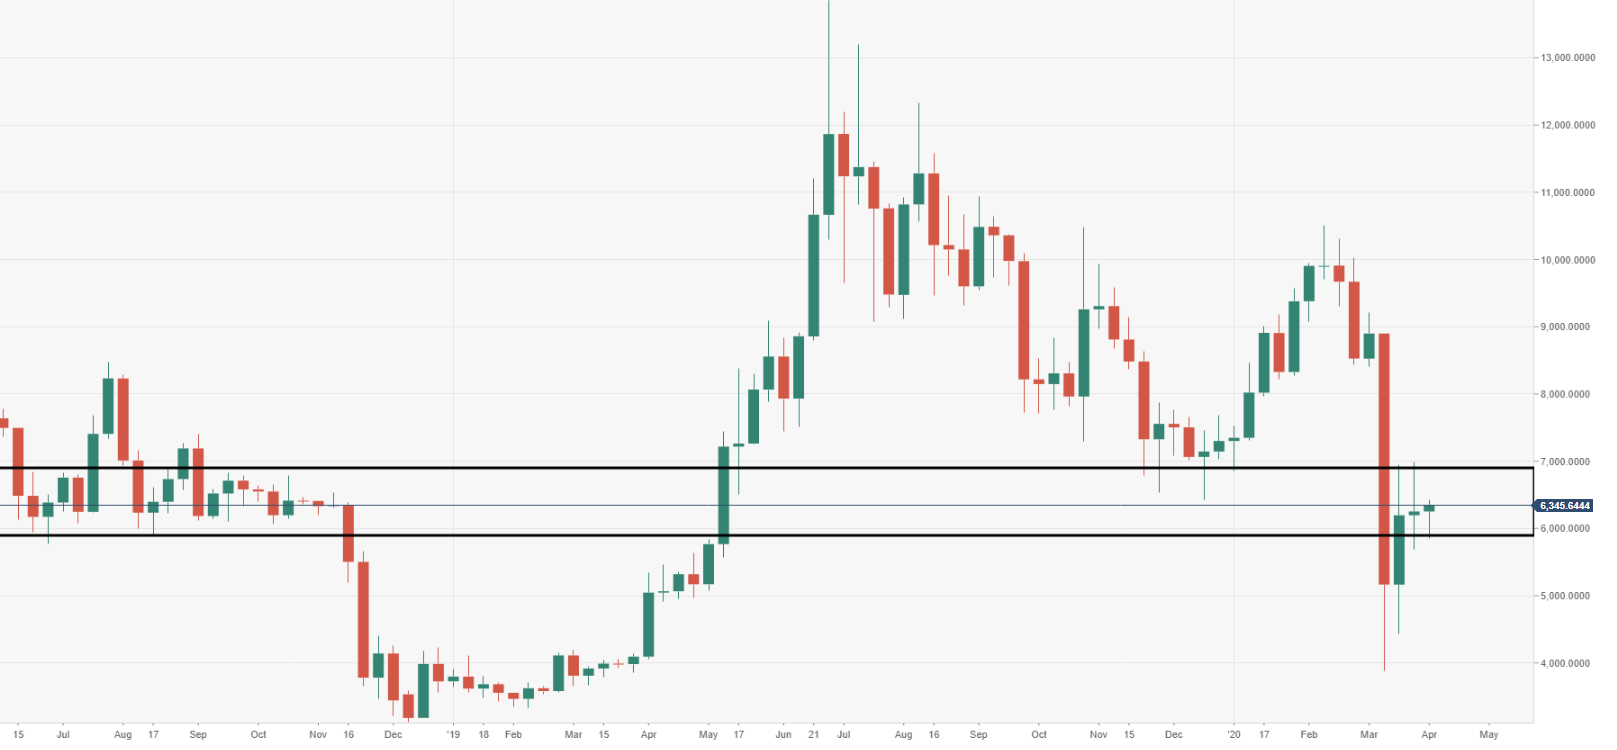
BTC/USD weekly chart
The price via the weekly has stabilized after the harsh week of 13 March. The $6000 price area continues to magnetized BTC, keep price action narrow.
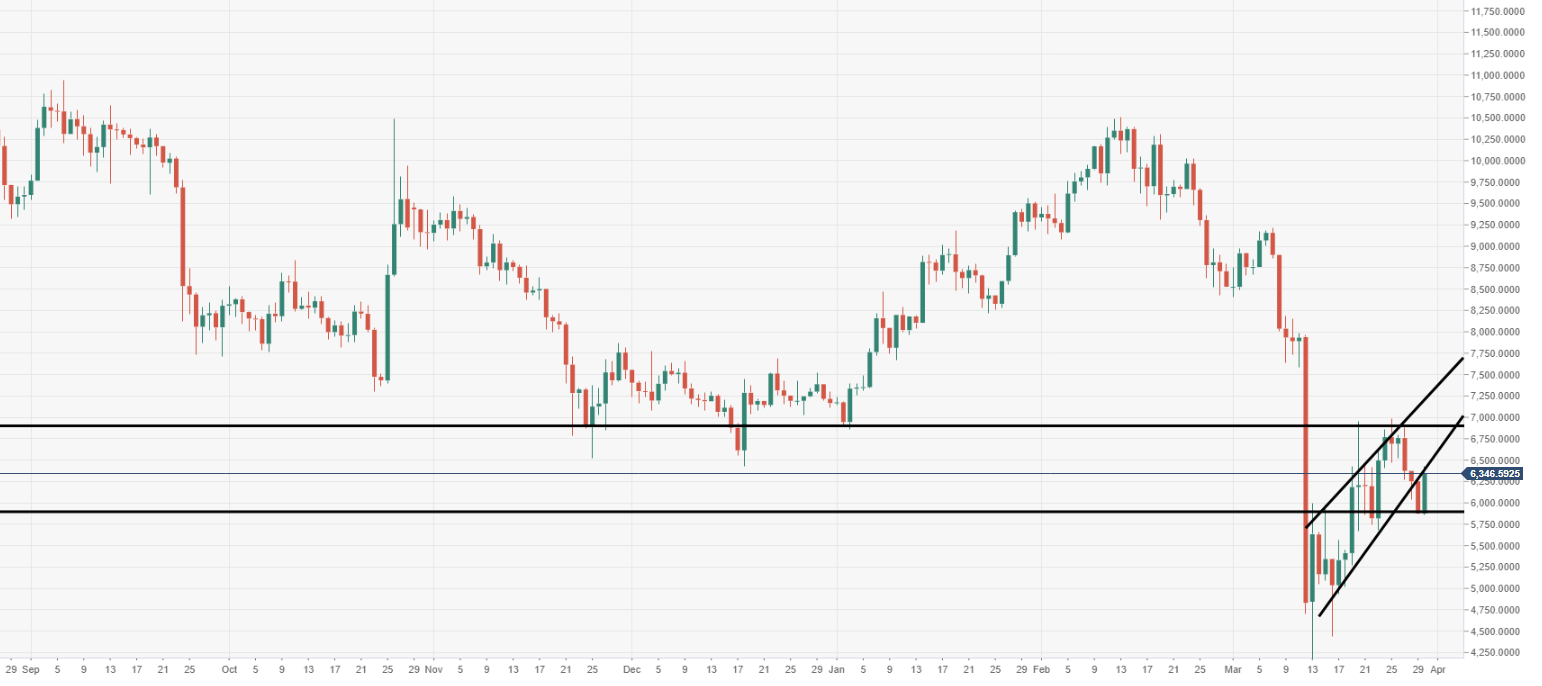
BTC/USD daily chart
The price smashed out of a bearish flag structure via the daily chart view, heading for a retest.
Spot rate: 6341.80
Relative change: +7.90%
High: 6429.54
Low: 5484.85
