- The MACD shows sustained bullish momentum.
- The SMA 200 has touched the SMA 50 to chart the highly bearish death cross pattern.
LTC/USD daily chart
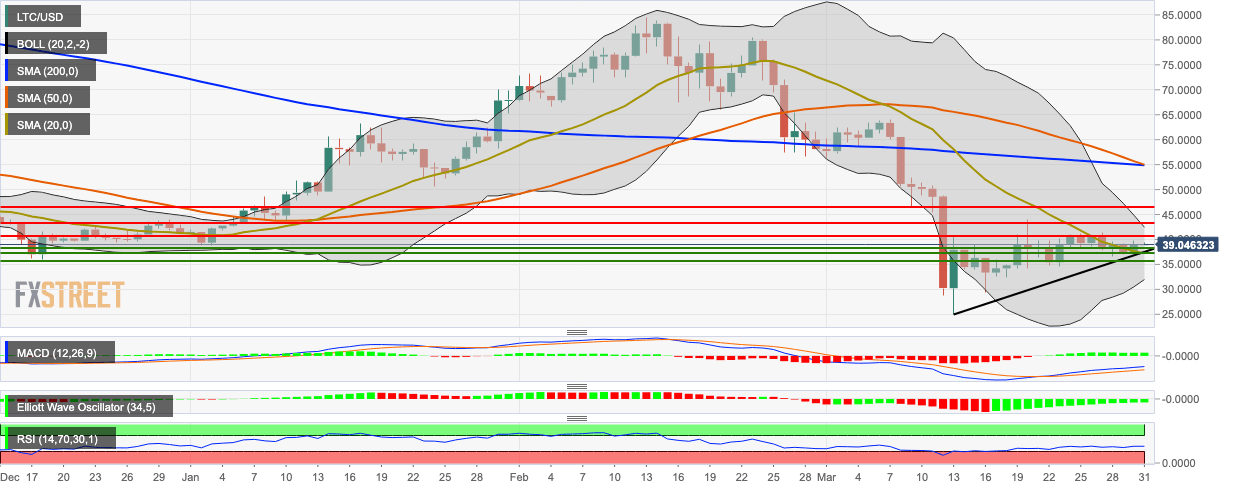
LTC/USD bears stepped in to correct the price this Tuesday as it fell from $39.15 to $38.70. This followed a bullish Monday wherein LTC/USD went up from $37.20 to $39.15. The 20-day Bollinger Band has considerably narrowed, indicating decreasing price volatility. The SMA 200 has touched the SMA 50, to chart the heavily bearish death cross pattern. The Elliott Oscillator has had 15 straight green sessions, while the MACD shows sustained, albeit decreasing, bullish momentum.
Key Levels
