- XRP/USD went up from $0.174 to $0.1758 this Wednesday.
- The Elliott Oscillator has had 17 straight green sessions.
XRP/USD daily chart
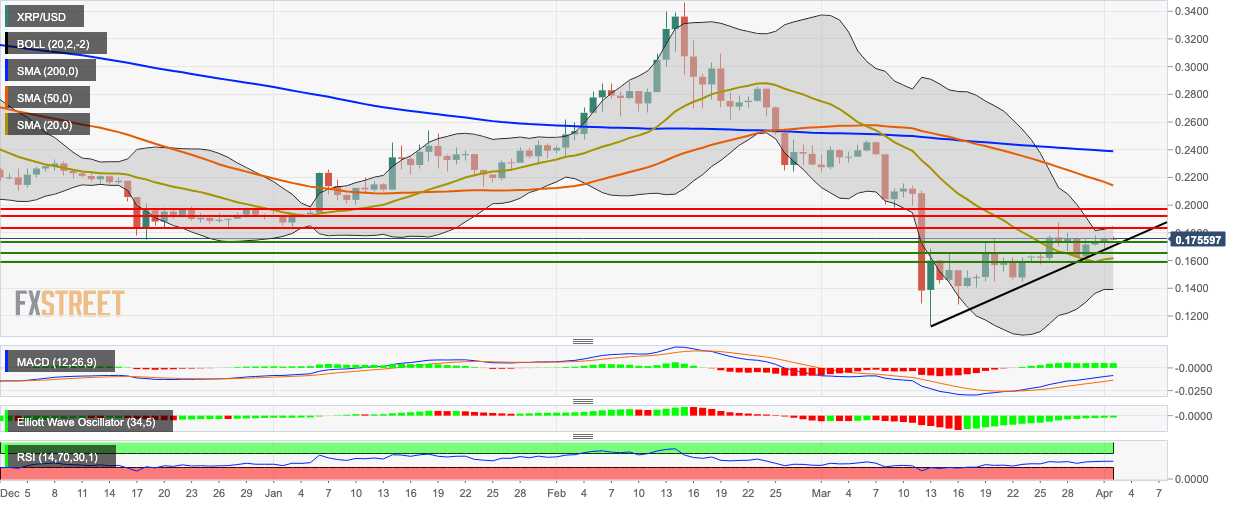
XRP/USD bears took control in the early hours of Thursday as the price fell from $0.1758 to $0.175. This followed a bullish Wednesday wherein the price went up from $0.174 to $0.1758. The support at the upward trending line needs to hold strong to curb further downward momentum. The 20-day Bollinger jaw has stopped constricting, indicating that price volatility has stopped decreasing. The MACD indicates sustained bullish momentum, while the Elliott Oscillator has had 17 straight green sessions. Finally, the RSI indicator is trending horizontally around 47.20.
