- BTC/USD has broken above the triangle pattern.
- BTC/USD has repeatedly failed to break past the critical $7,200 resistance level over the past few days.
BTC/USD daily chart
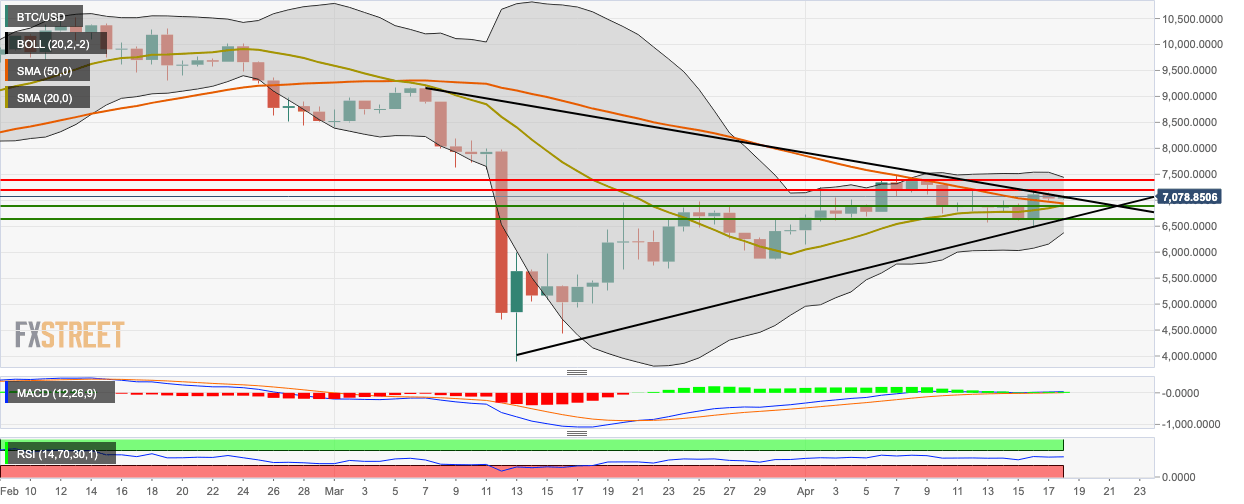
BTC/USD had a bullish start to Saturday as the price went up slightly from $7,032.84 to $7,097.75. In the process, it managed to break above the triangle pattern. Over the past few days, the $7,200 resistance level has repeatedly thwarted the buyers. They will need to conquer to continue and, more importantly, sustain the bullish momentum. Many popular analysts like Josh Rager have identified the $7,400 line as the next big resistance level to conquer, which could possibly trigger a significant uptrend. Rager did nite that he isn’t expecting this to happen over the weekend since Saturday is usually an infamously slow day for BTC/USD.
Super exciting $150 range for BTC ever since the move up from sub $6600. Expecting some consolidation before the next move – still watching $7400 as the area to break. Saturdays are notoriously known to be boring so not expecting much tomorrow and more action on Sunday.
The 20-day Bollinger jaw has narrowed as well, indicating decreasing price volatility, which corroborates the “slow Saturday” theory. However, the SMA 20 is looking to crossover the SMA 50, to chart the bullish cross pattern. The MACD indicates increasing bullish momentum, while the RSI has flatlined around 54.
