- XRP/USD crossed the SMA 20 in the daily chart.
- XRP/USD 4-hour chart faces immediate resistance at the red Ichimoku cloud.
XRP/USD daily chart
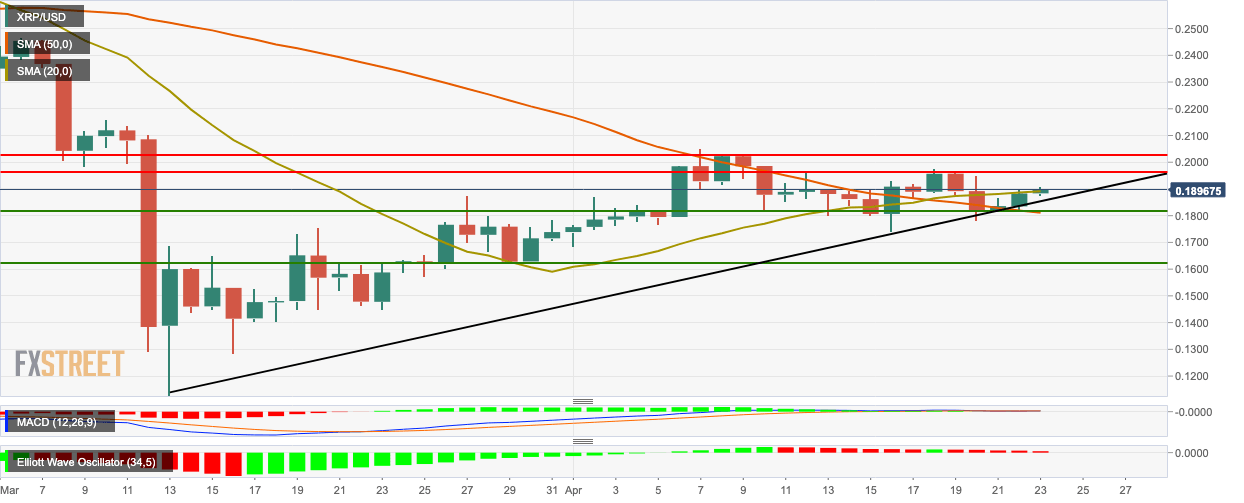
XRP/USD bulls retained control as the price jumped from $0.1883 to $0.1902. In the process, XRP/USD managed to break above the SMA 20. The MACD indicates decreasing bearish momentum, while the Elliott Oscillator had 12 red sessions out of the last 13.
XRP/USD 4-hour chart
-637232065458838739.png)
The 4-hour XRP/USD charts in an upwards channel formation as the price finds resistance at the red Ichimoku cloud. In the process, XRP/USD managed to break above the SMA 20 and SMA 50 curves. The MACD indicates increasing bullish momentum.
Key levels
