- IOT/USD bounced off the support at SMA 20.
- The Elliott Oscillator has had a green session after 11 red sessions.
IOT/USD daily chart
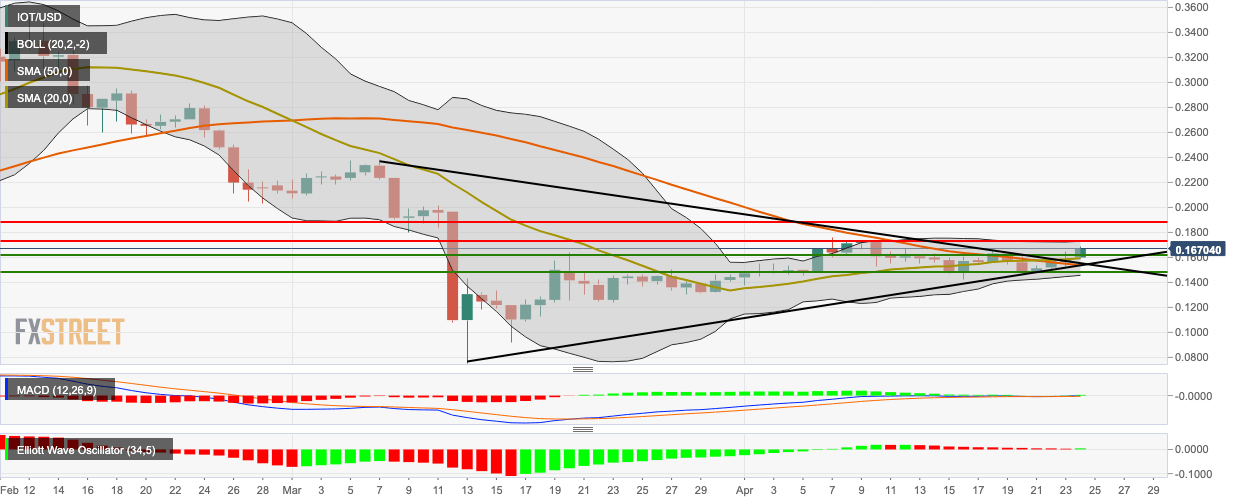
IOT/USD went up from $0.1599 to $0.1674 this Friday as the bulls retained control for the fourth consecutive day. The price jumped above the triangle formation and will now look to overcome resistance at the $0.1734 line and the upper curve of the 20-day Bollinger band. The MACD shows increasing bullish momentum, while the Elliott Oscillator has had a green session after 11 red sessions. The narrowing of the 20-day Bollinger jaw indicates decreasing price volatility.
Key levels IOT/USD
