- Bitcoin settled above $9,000, however, the critical $9,500 remains intact.
- The technical picture implies that the upside momentum may gain traction.
Bitcoin price managed to hit highs of $9,398 on Wednesday before retreating to $9,250 by press time. The level at $9,000 remains the pivotal support for the first digital coin. If it is broken, the sell-off may continue towards the intraday lows of $8,922. The American session is likely to remain bullish as volatility stays high. Other major cryptocurrencies such as Ripple and Ethereum are also on the rise. The coins have gained 1.9% and 2.0% respectively.
The daily chart shows the RSI looking upwards above 70 (overbought zone). It means that the coin has the potential to move towards $9,500.
BTC/USD daily chart
-637243722872744161.png)
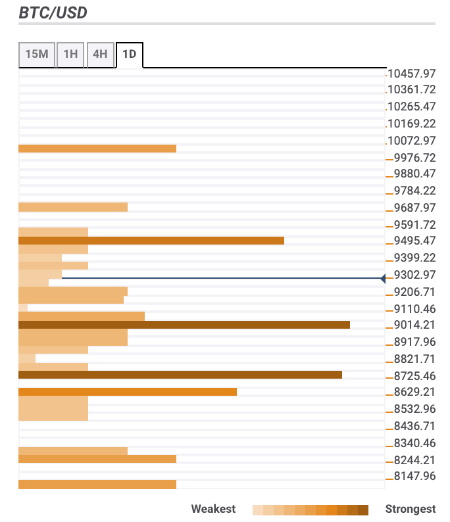
Let’s have a closer look at support and resistance levels clustered around the current price.
Resistance levels
$9,500 – the highest level of the previous week and the highest level of the previous month
$9,700 – Pivot point 1 week Resistance 1
$10,000 – Pivot point 1 month Resistance 1
Support levels
$9,000 – 1-hour SMA100 and SMA50, daily SMA5, 15-min SMA200
$8,800 – 23.6% Fibo retracement monthly, 4-hour SMA50, 1-hour SMA200, 38.2% Fibo retracement weekly
$8,600 – the lower line of the 4-hour Bollinger Band, Pivot Point 1 day Support 2
BTC/USD, daily