- NEO has jumped a massive 7.5% on Thursday but the celebration could be short-lived.
- The price is heading to the channel high and psychological 10.00 level.
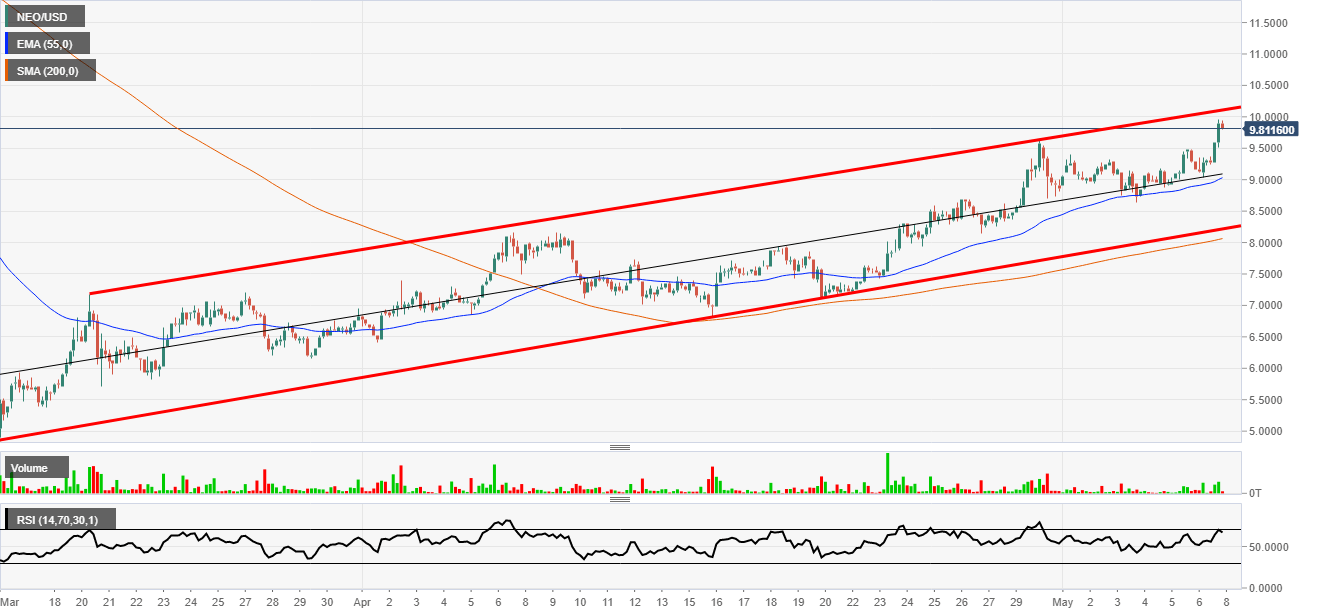
NEO/USD 4-hour chart
NEO has had an amazing run and you can see the perfect trend on the 4-hour chart below. The price has moved in the channel formation marked in red ever since the sell-off that saw the pair hit a low of 4.00 on March 13th.
Now it seems that the price is about to hit some resistance that has been historically respected. Not only on this chart, but the daily chart also shows the psychological 10.00 figure has acted as both a support and resistance zone on multiple occasions.
Looking at the indicators now, it seems pretty obvious they are all in bullish areas. The one surprise might be the volume, you would expect it to be higher in such a move. Lastly the regression line in the middle of the chart is also be proving to be useful. The price has bounce off the line many times and it would be wise to watch it if the price moved lower.
Additional levels
